AdriaArray - Seismic networks
In various stages of planning and for different purposes, we prepared maps showing the distribution of permanent stations and suggested locations of temporary stations. The maps cover a range of complexity from very simple ones using just two colors to more complex figures explaining the station distribution in detail. Below, we show some of the maps. All the maps and supporting files can be downloaded from the AdriaArray GitHub repository.
AdriaArray GitHub repository
The repository contains the AdA folder, which includes permanent and temporary station inventories.
The following two texts files describe what else you can find in the AdriaArray GitHub repository.
The file maps-legend.pdf explains how the AdriaArray network was planned and what can be seen on the maps. It is enough to read this text to understand the maps provided.
The file maps-manual.pdf talks about the scripts and how to produce the maps from the station inventories. This could be useful when you are about to modify the scripts and produce your own maps.
If you want to just take the maps provided, go to AdA/MAPS/.
If you want to display the stations in GoogleEarth, go to AdA/GOOG/ to get the .kml files.
The folder presentations contains some of the slides and poster about the AdriaArray Seismic Network presented in last years.
Station maps
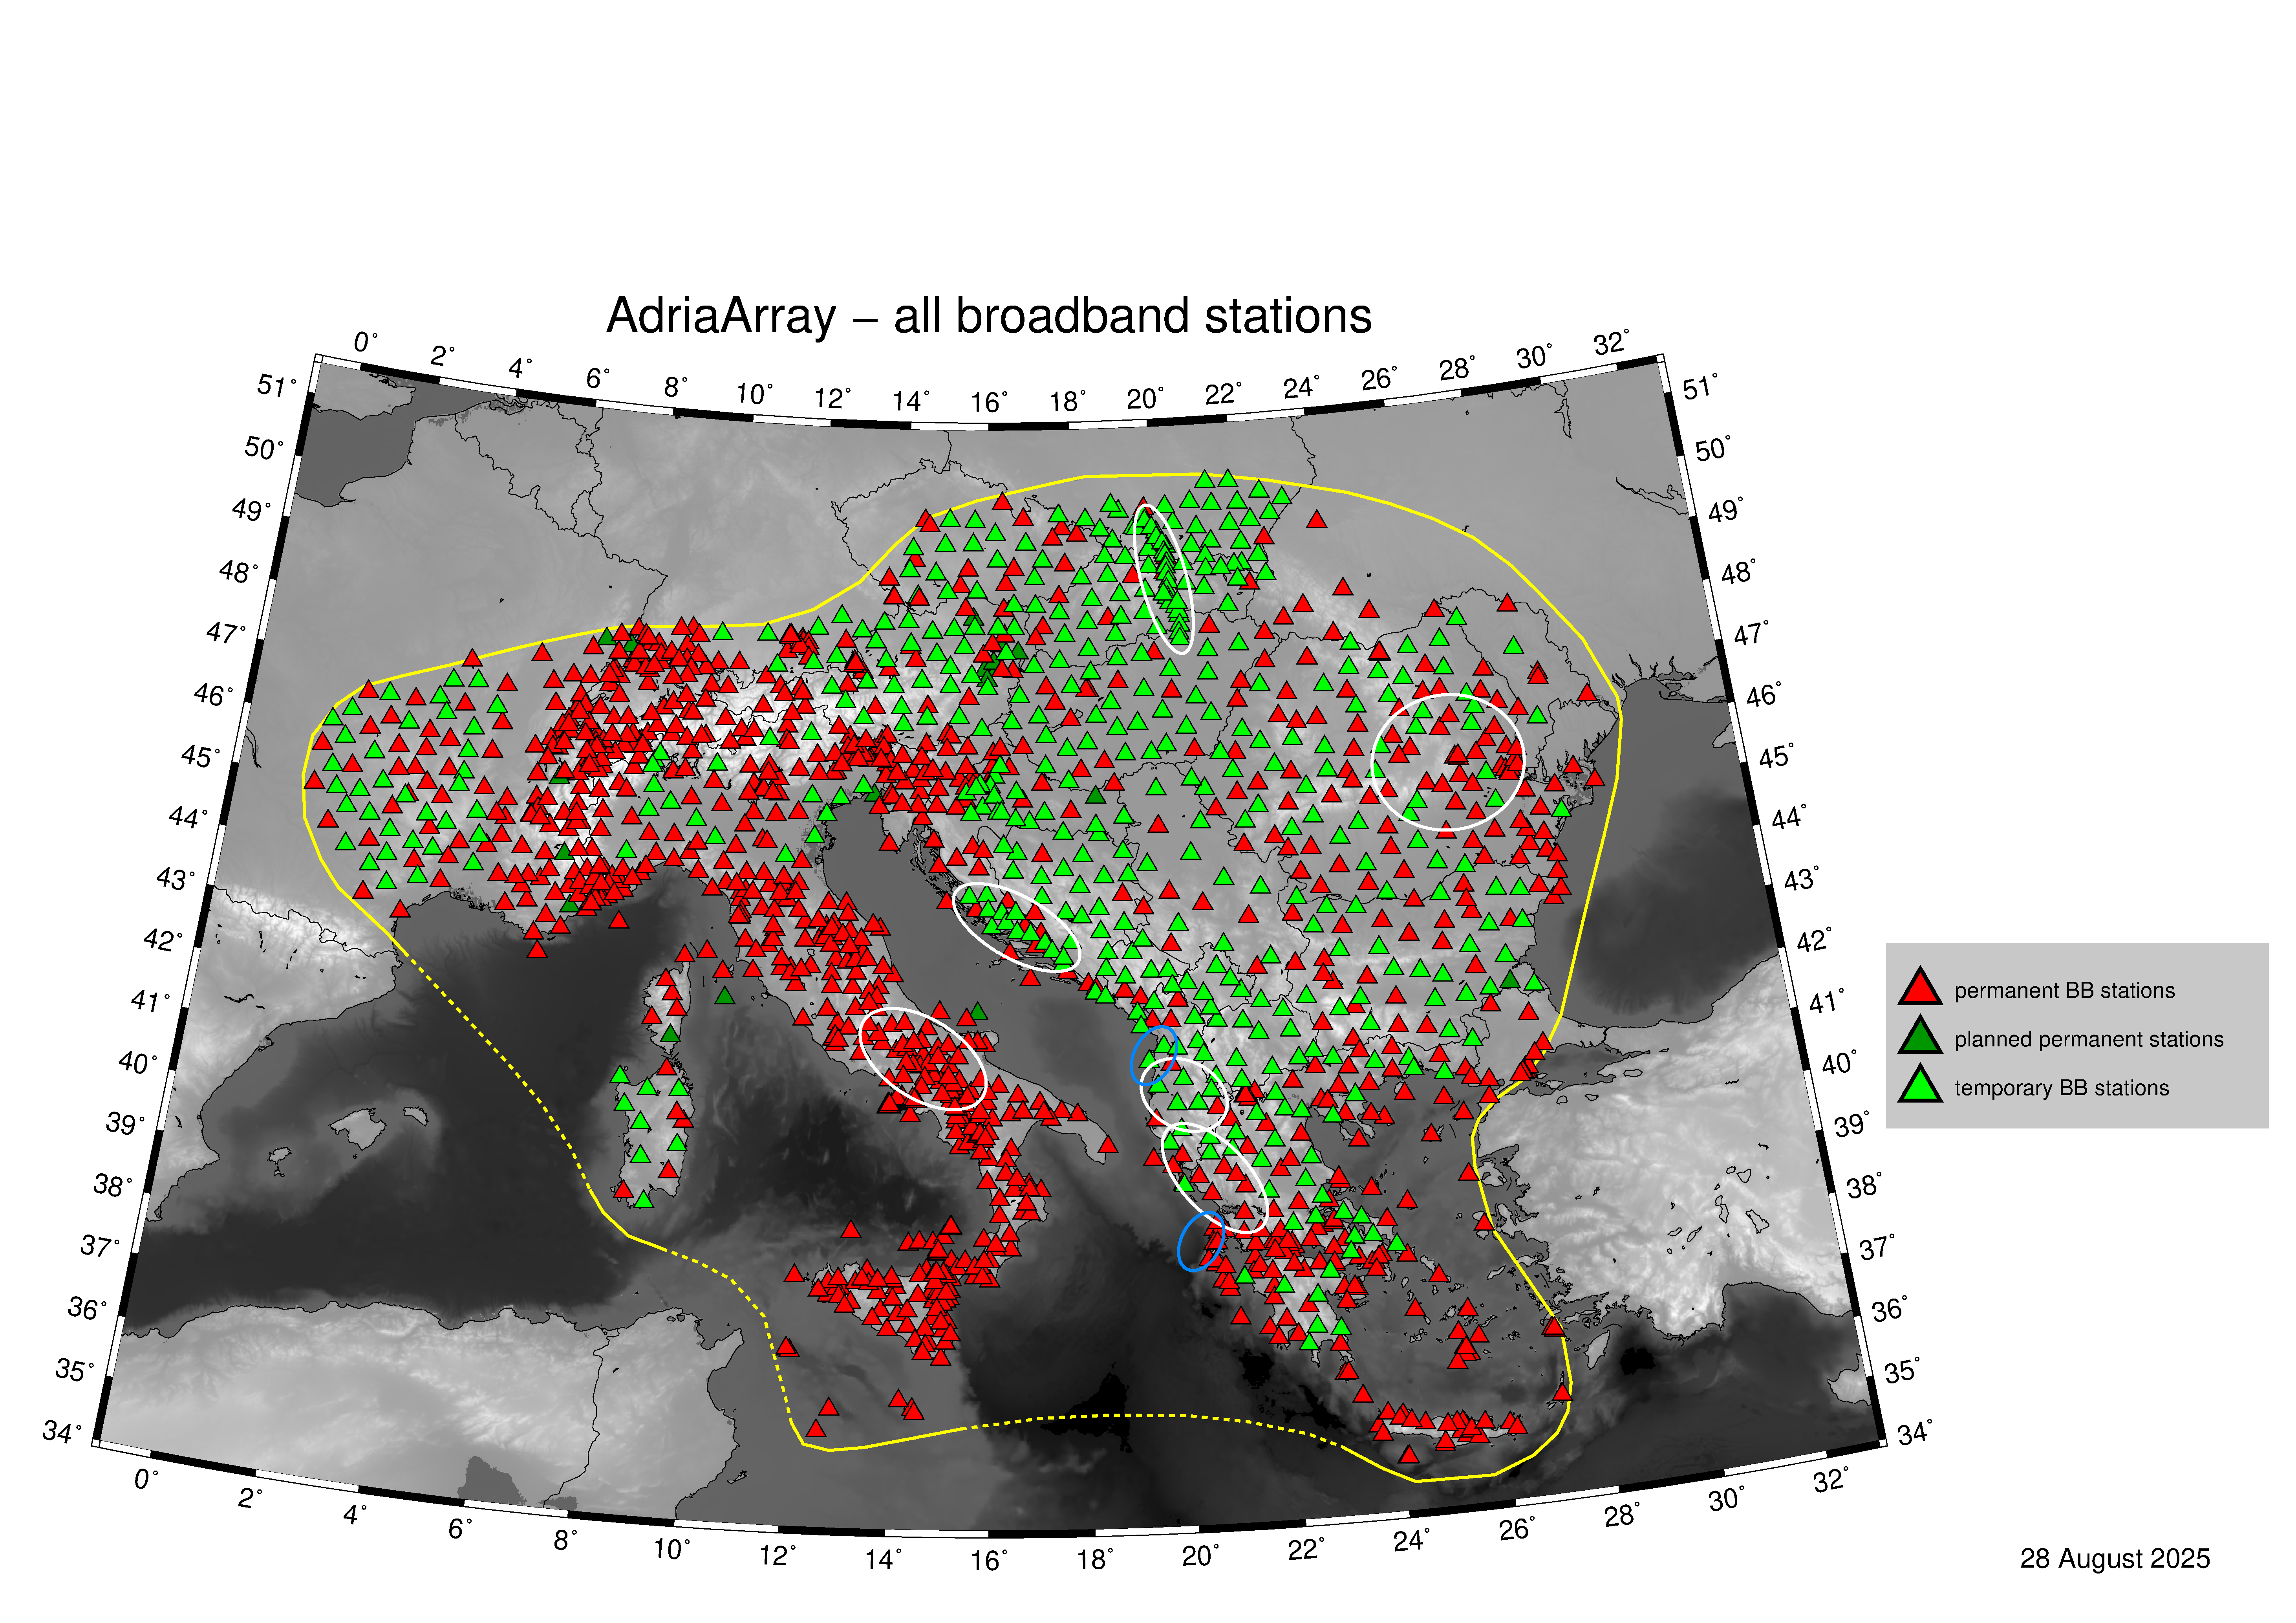
Highly simplified map showing only the broadband permanent and mobile stations regardless of their type. Permanent stations are marked with red triangles while temporary stations are marked with light green triangles.

Permanent stations, both inside and outside of the AdA region, grouped by the corner period into 3 categories (red: corner period of 60 s and longer, orange: corner period between = 40 and < 60 s, yellow: corner period = 30 s). Dark blue are the PACASE stations planned to stay in place for the AdriaArray. Light green are the stations which were agreed by the local network operators as a suitable spots for deployment of mobile BB station. These include short-period stations, accelerometers and BB stations with corner period < 30 s. Light blue are the spots where there was a station before, so called “unequipped spots”. White is the same category as green, but for these, we did not asked to serve as a places for mobile upgrade as these spots were not needed for the backbone. Gray are the stations not available or suitable for upgrade. Dark green are BB stations to be build in near future of 1 year. Five different pinkish colors show the mobile stations for respective subgroups. These triangles are empty inside. This allows to see that sometimes there is a permanent spot under. It means, such a mobile station is suggested to be placed at existing spot. These are light blue (unequipped spots), green (< 30 s, SP/SM stations) as well as yellow (= 30 s stations).
Station names: For permanent stations, their respective names are shown in the map. For mobile stations, several situations can happen: if the mobile is suggested to be placed at the permanent spot, again the permanent name is shown. If it is a PACASE spot, the given PACASE temporary name is used. If it is a former AlpArray spot, the given temporary AlpArray name is used. If it is an unequipped spot where there was a name found for that spot, this name is used (e.g. CASE stations), sometimes simply the name of the village is shown. In Romania, these places are named as ZROxx, where xx is a number. When the mobile station is suggested at a new place, which needs to be scouted for, the name is created using two characters showing the country of deployment plus two digits with a numbering in the respective country.
Permanent stations outside of the AdriaArray region are shown by empty triangles with respective color as in the legend. Big white and blue ellipses show schematically the planned local experiments. The station colors of this map are reflected in the .kml files, and hence one can reproduce almost the same layout also in GoogleEarth. In the 01AdriaTotal map, all stations with corner period of 60 s and longer are shown by red triangles. The .kml files have additional two bands corresponding to the map 17AdAcorners, see below.
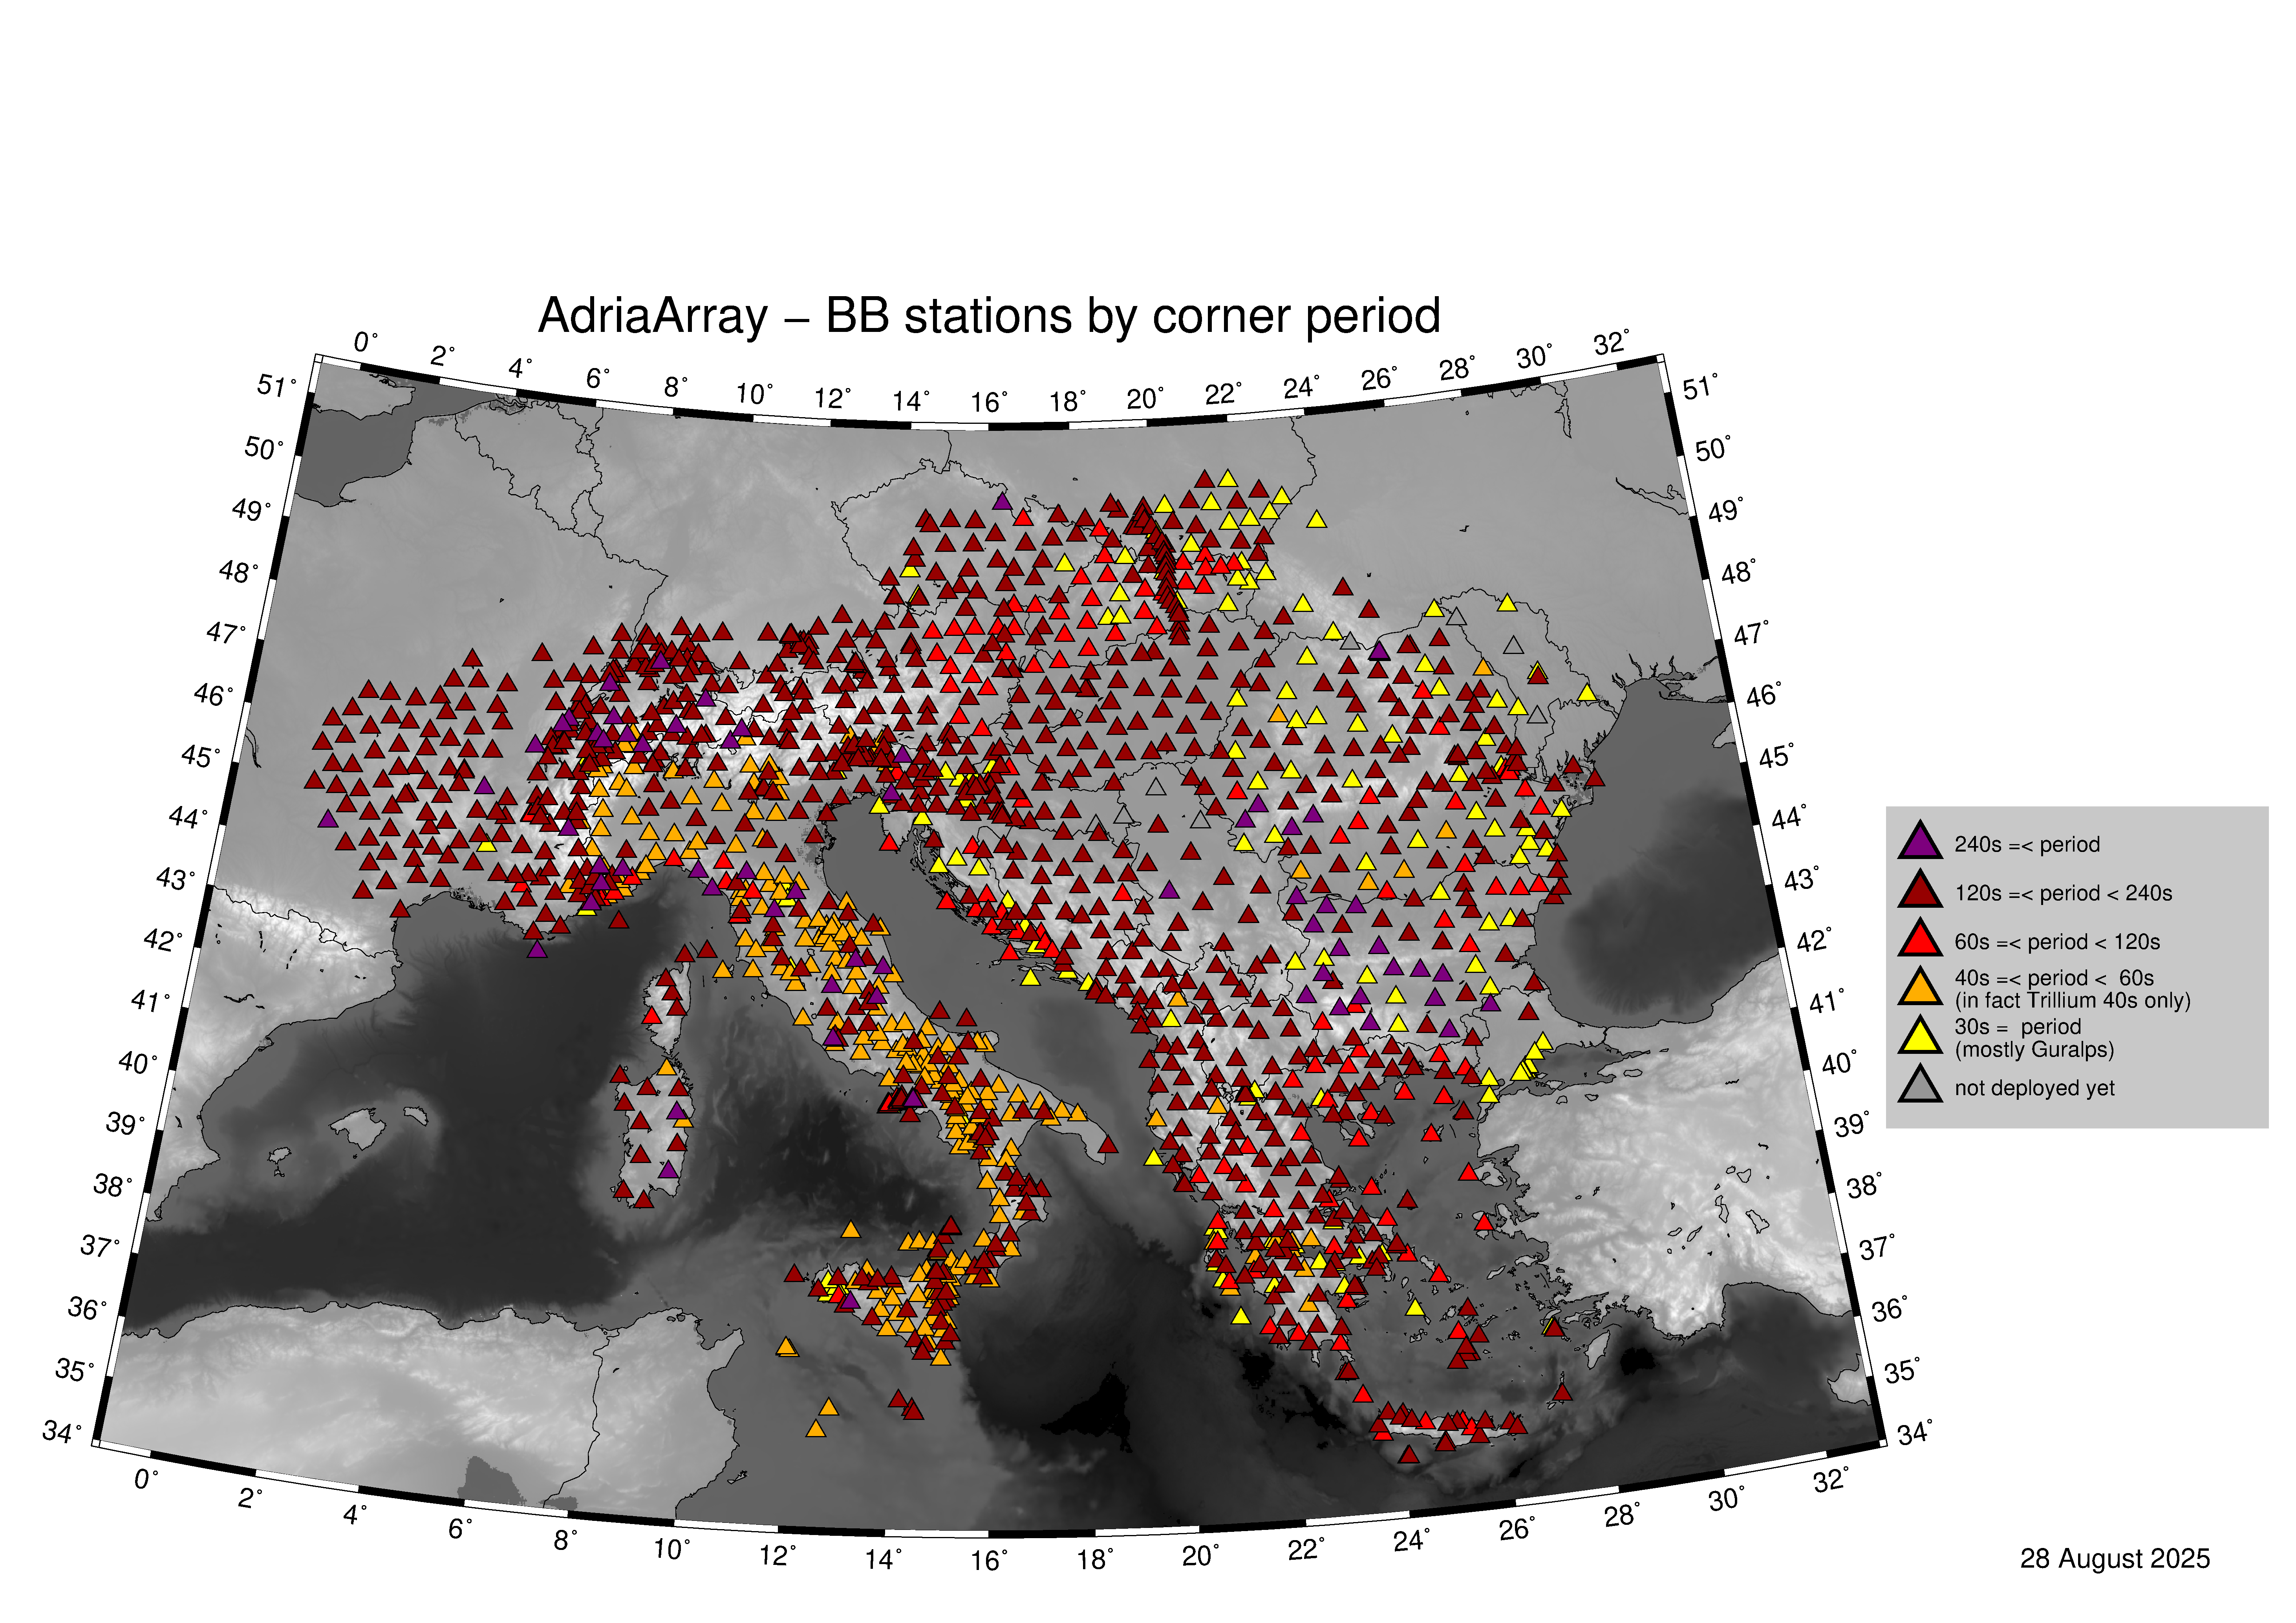
Map shows both permanent and temporary stations (backbone) split by five corner period ranges. Note, that in the previous maps, the red color denoted all corner periods of 60 s and longer, while here, red is used for 60 s up to 120 s only. Longer corner periods have then additional colors for 120 – 240 s range and for 240 and longer.
Station list
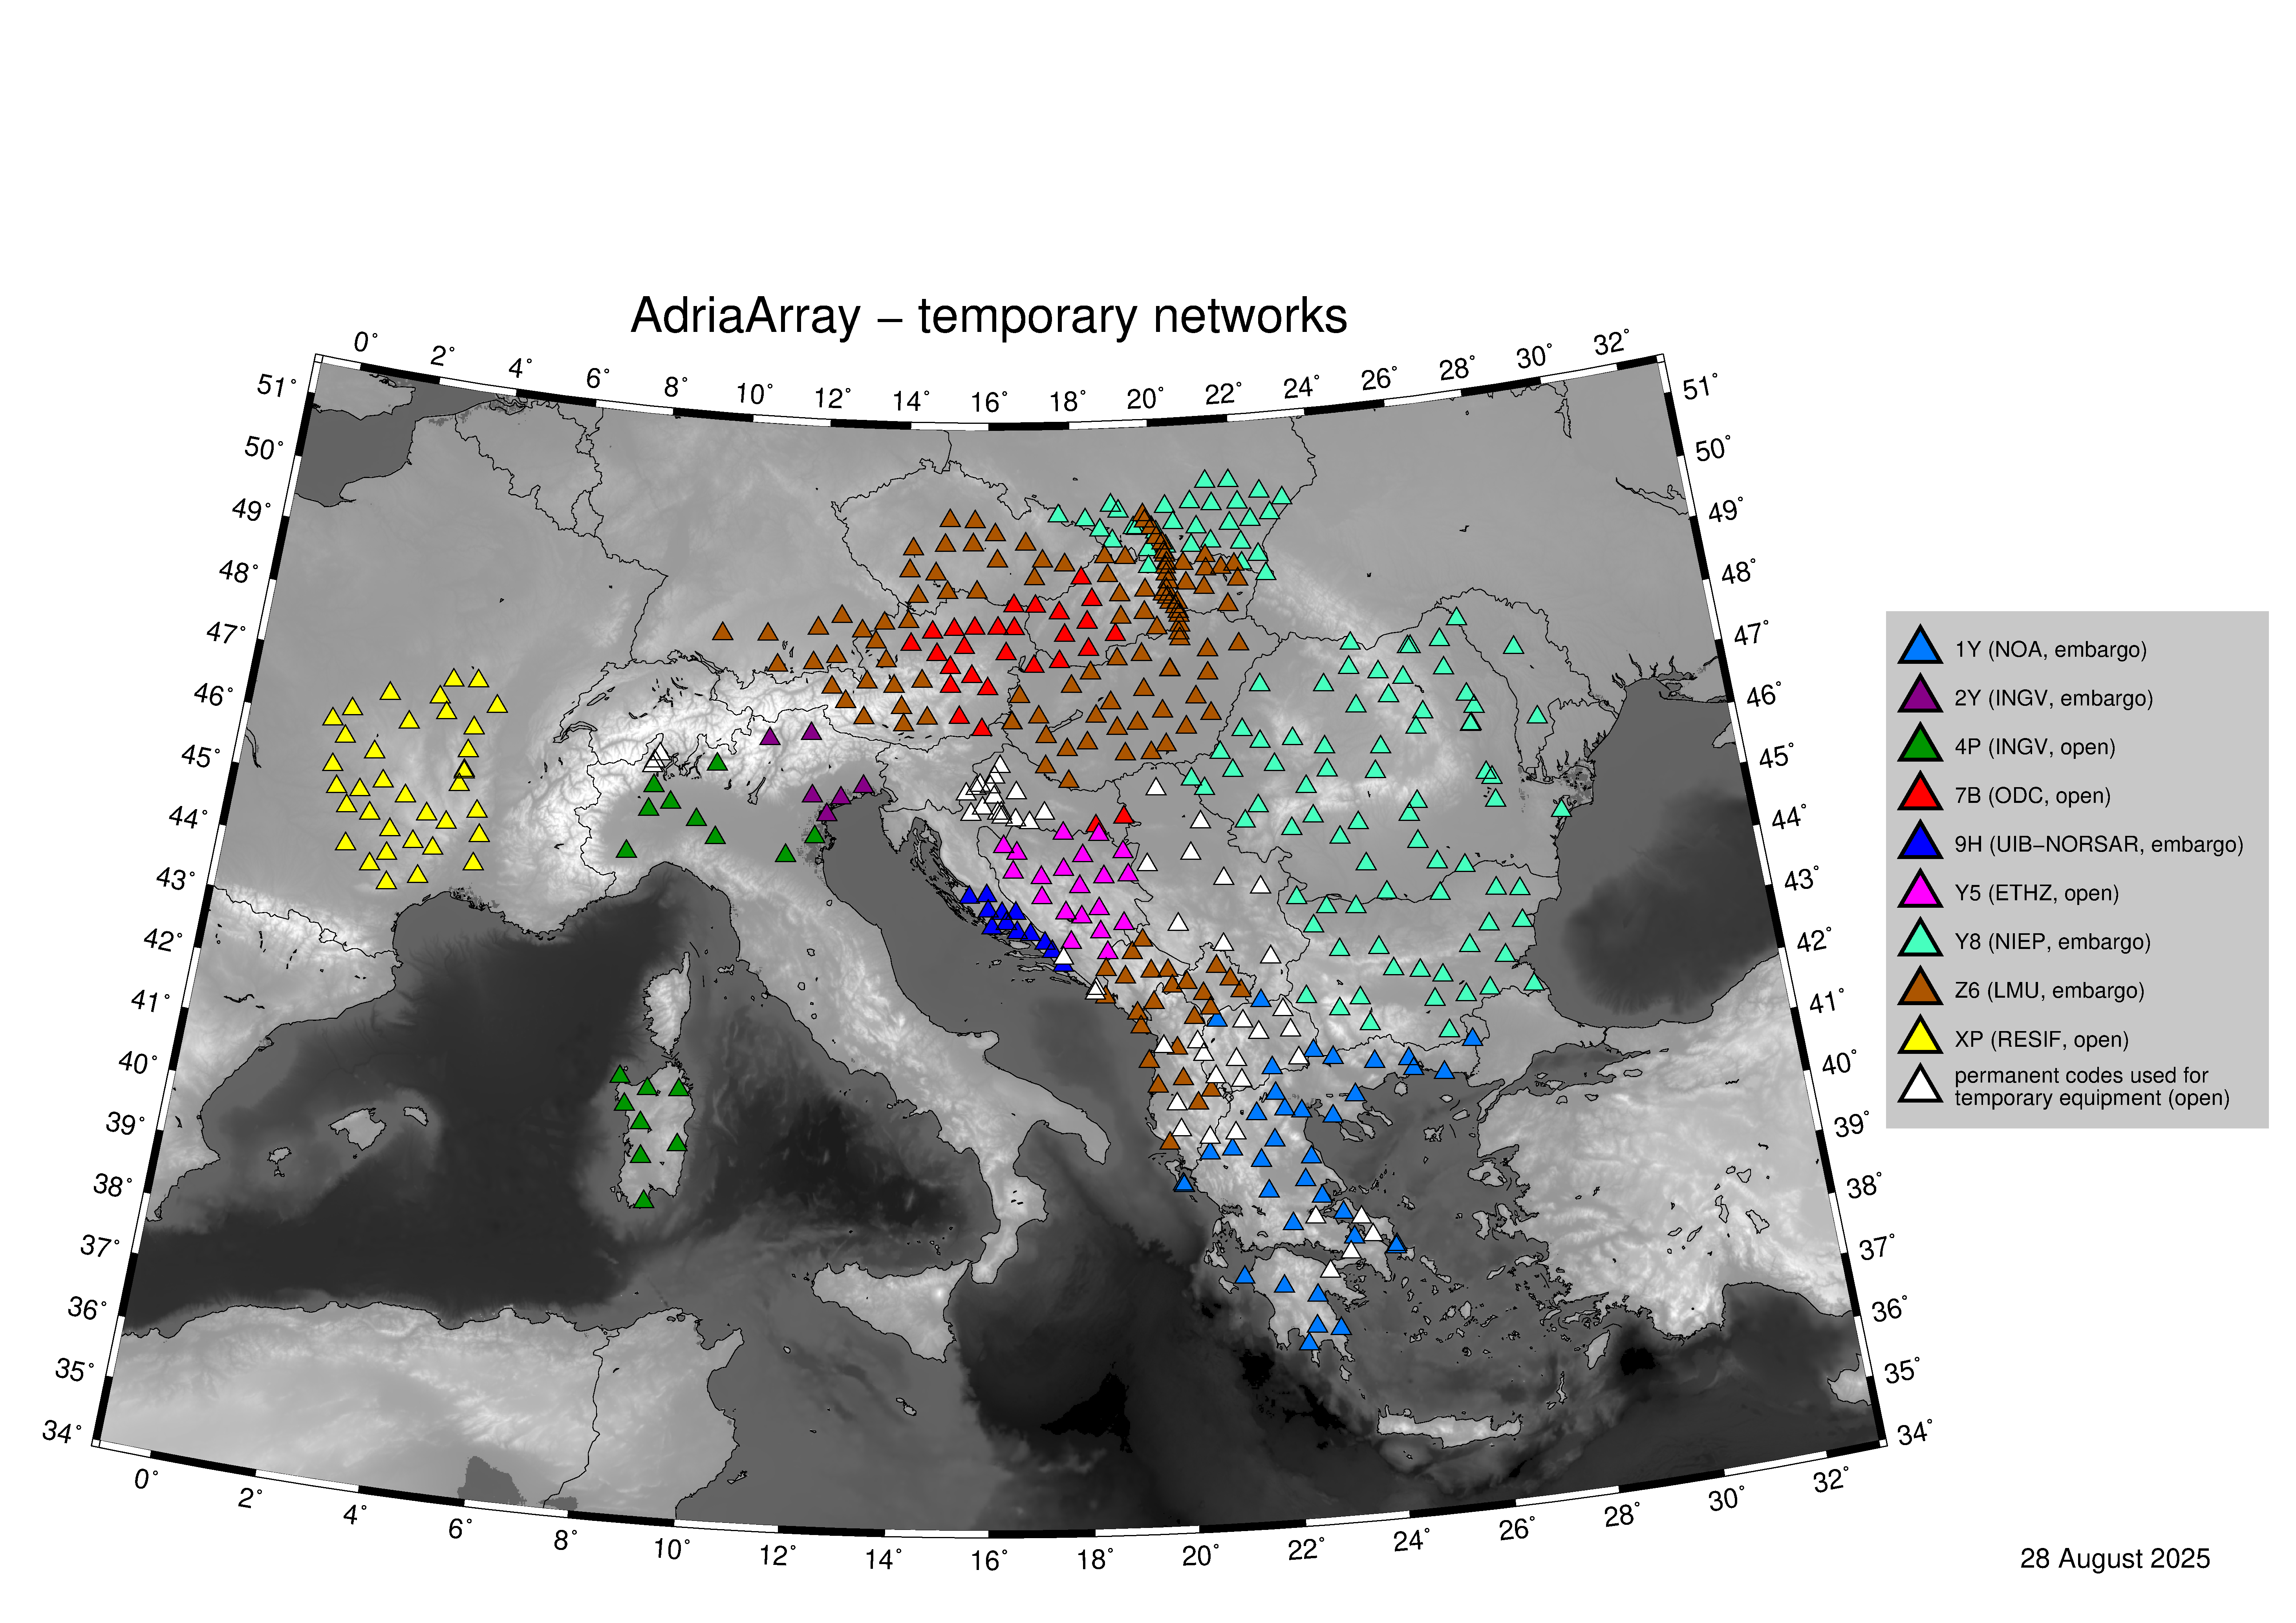
The data and metadata of all permanent and temporary stations belonging to the AdriaArray Seismic Network are availalbe via EIDA. The temporary networks are registered and listed by FDSN.
Broadband stations covering homogeneously the AdriaArray region outlined by the yellow line in the maps form the AdriaArray backbone. The shortest corner period of the backbone is 30s. To download the data, a virtual network _ADARRAY can be used. All broadband stations in the region with HH* and BH* channels are included in _ADARRAY. According to the SEED convention, H** and B** channels are assigned for sensors with corner period of equal or longer than 10 s. _ADARRAY virtual network hence includes more stations than the AdriaArray backbone. The backbone is a subset of _ADARRAY.
Network & status of station operation
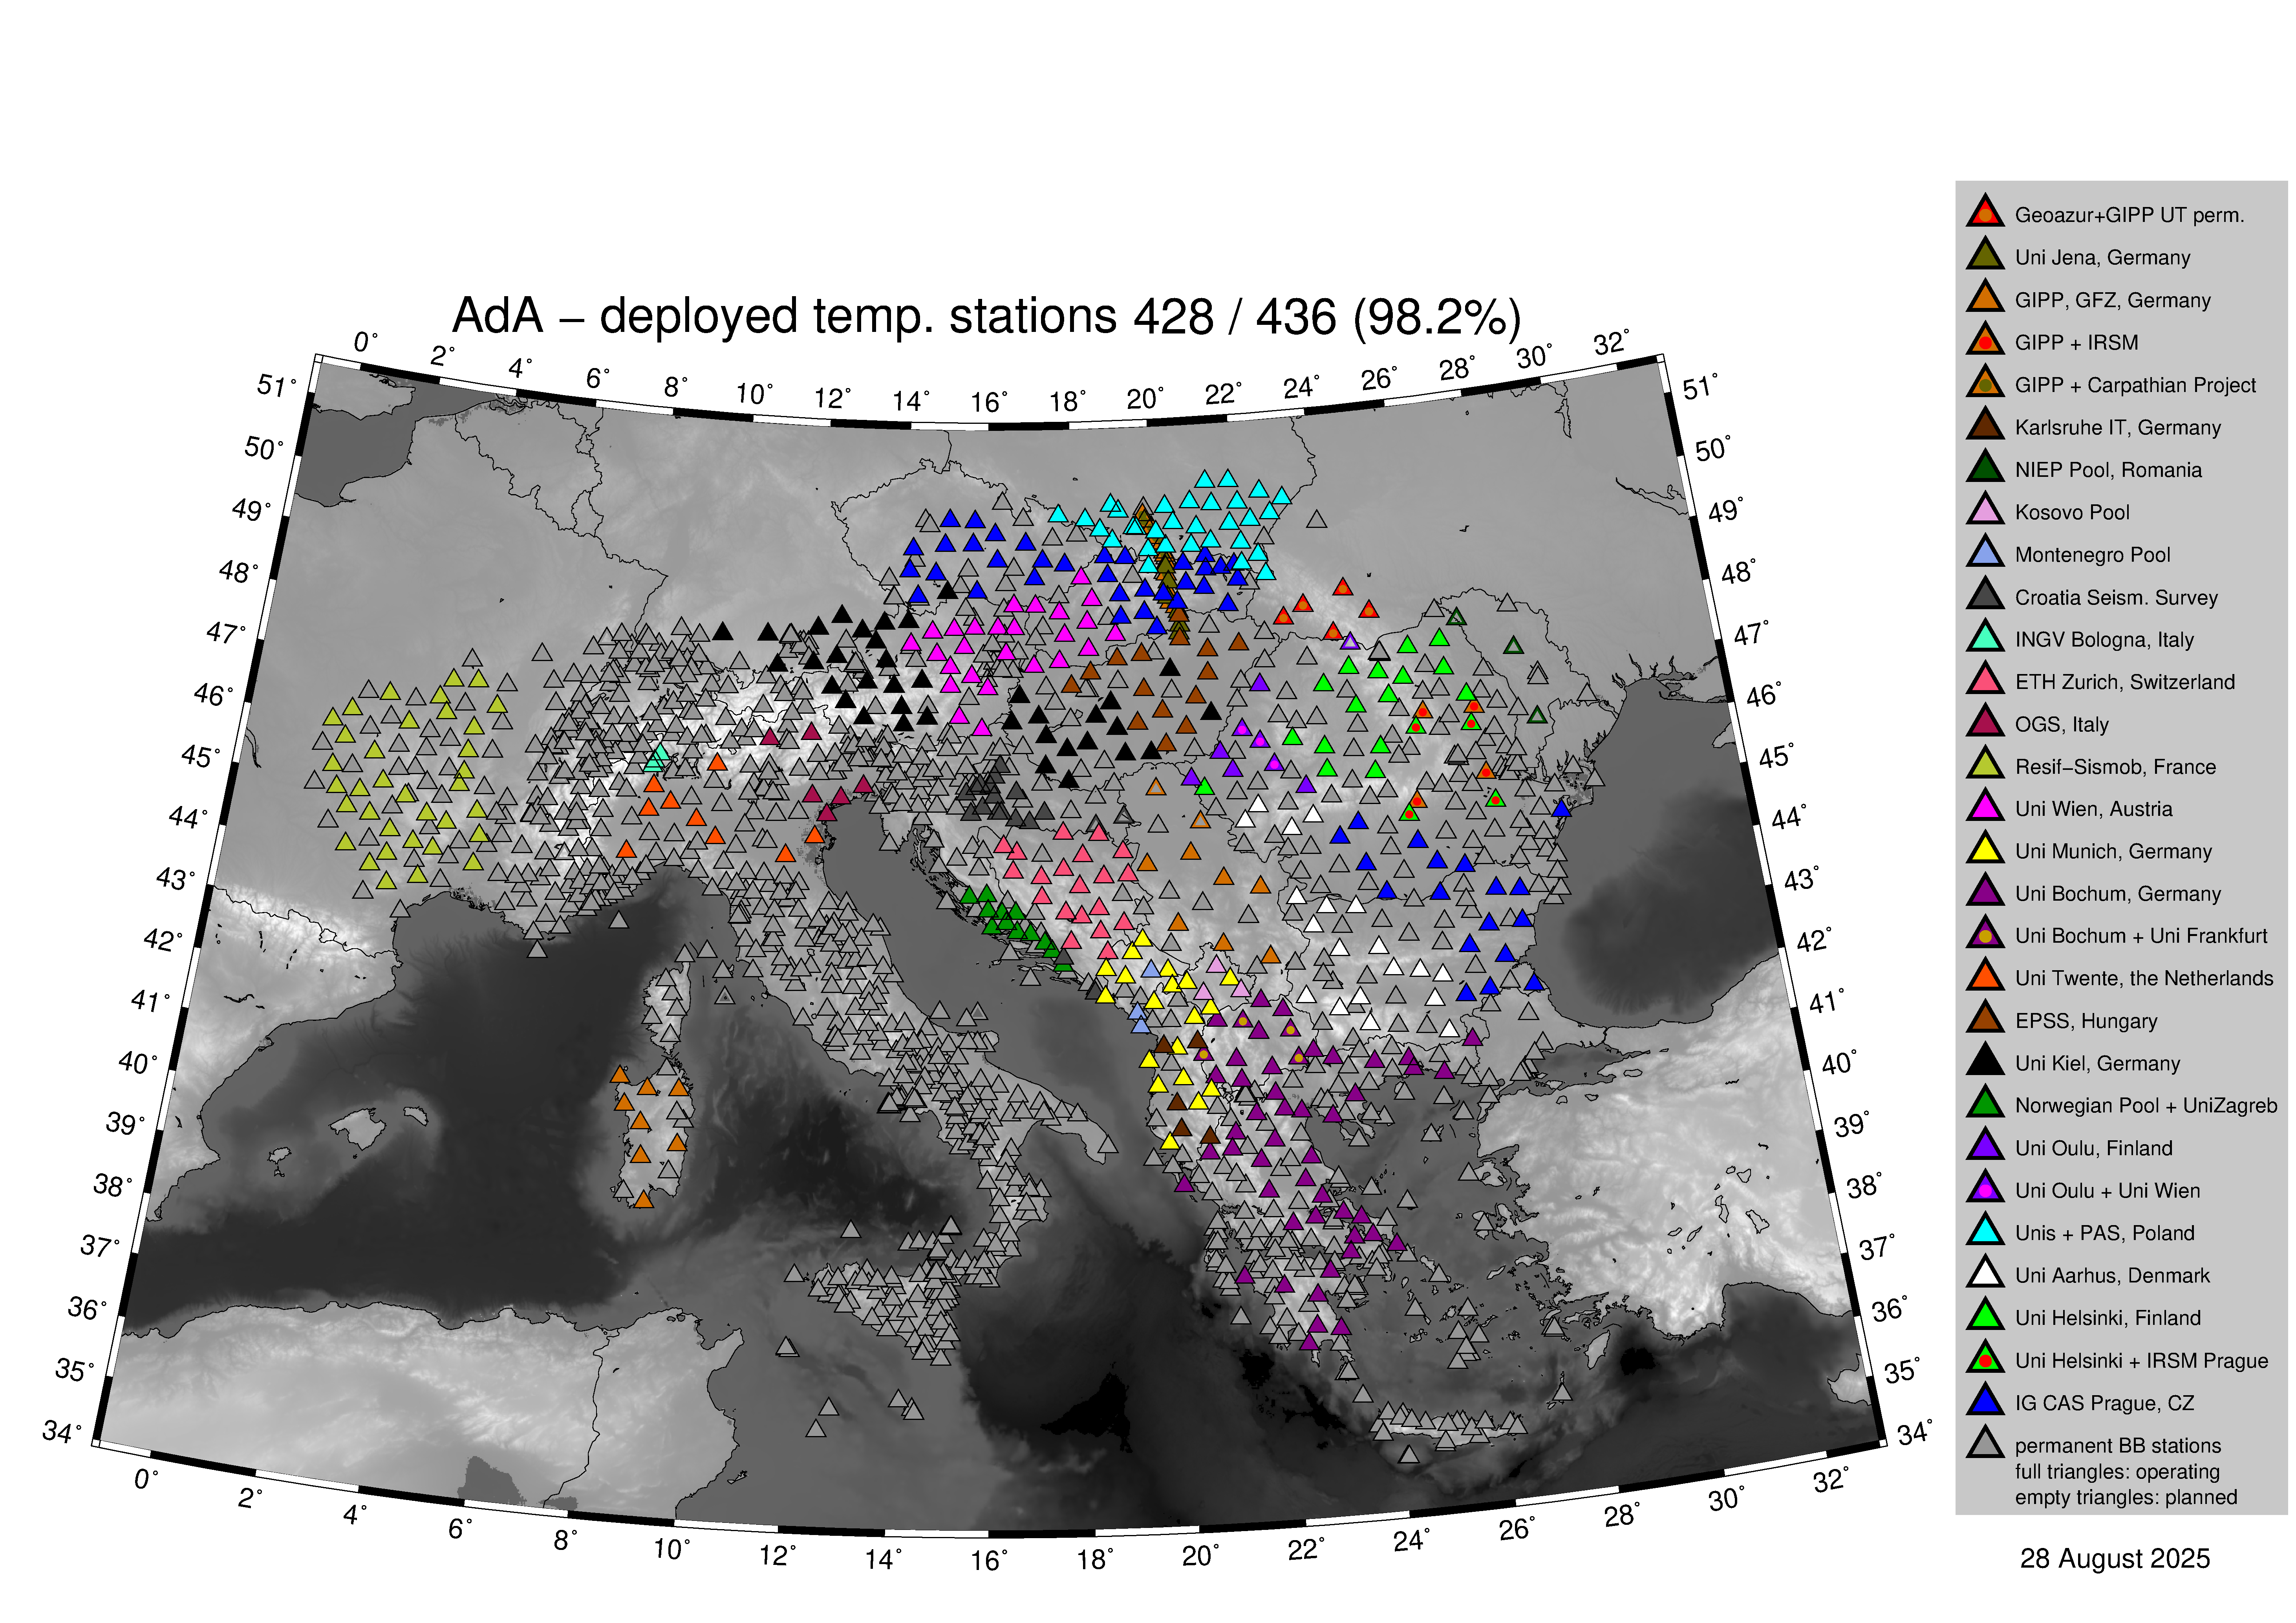
Current status of the deployment of mobile stations:
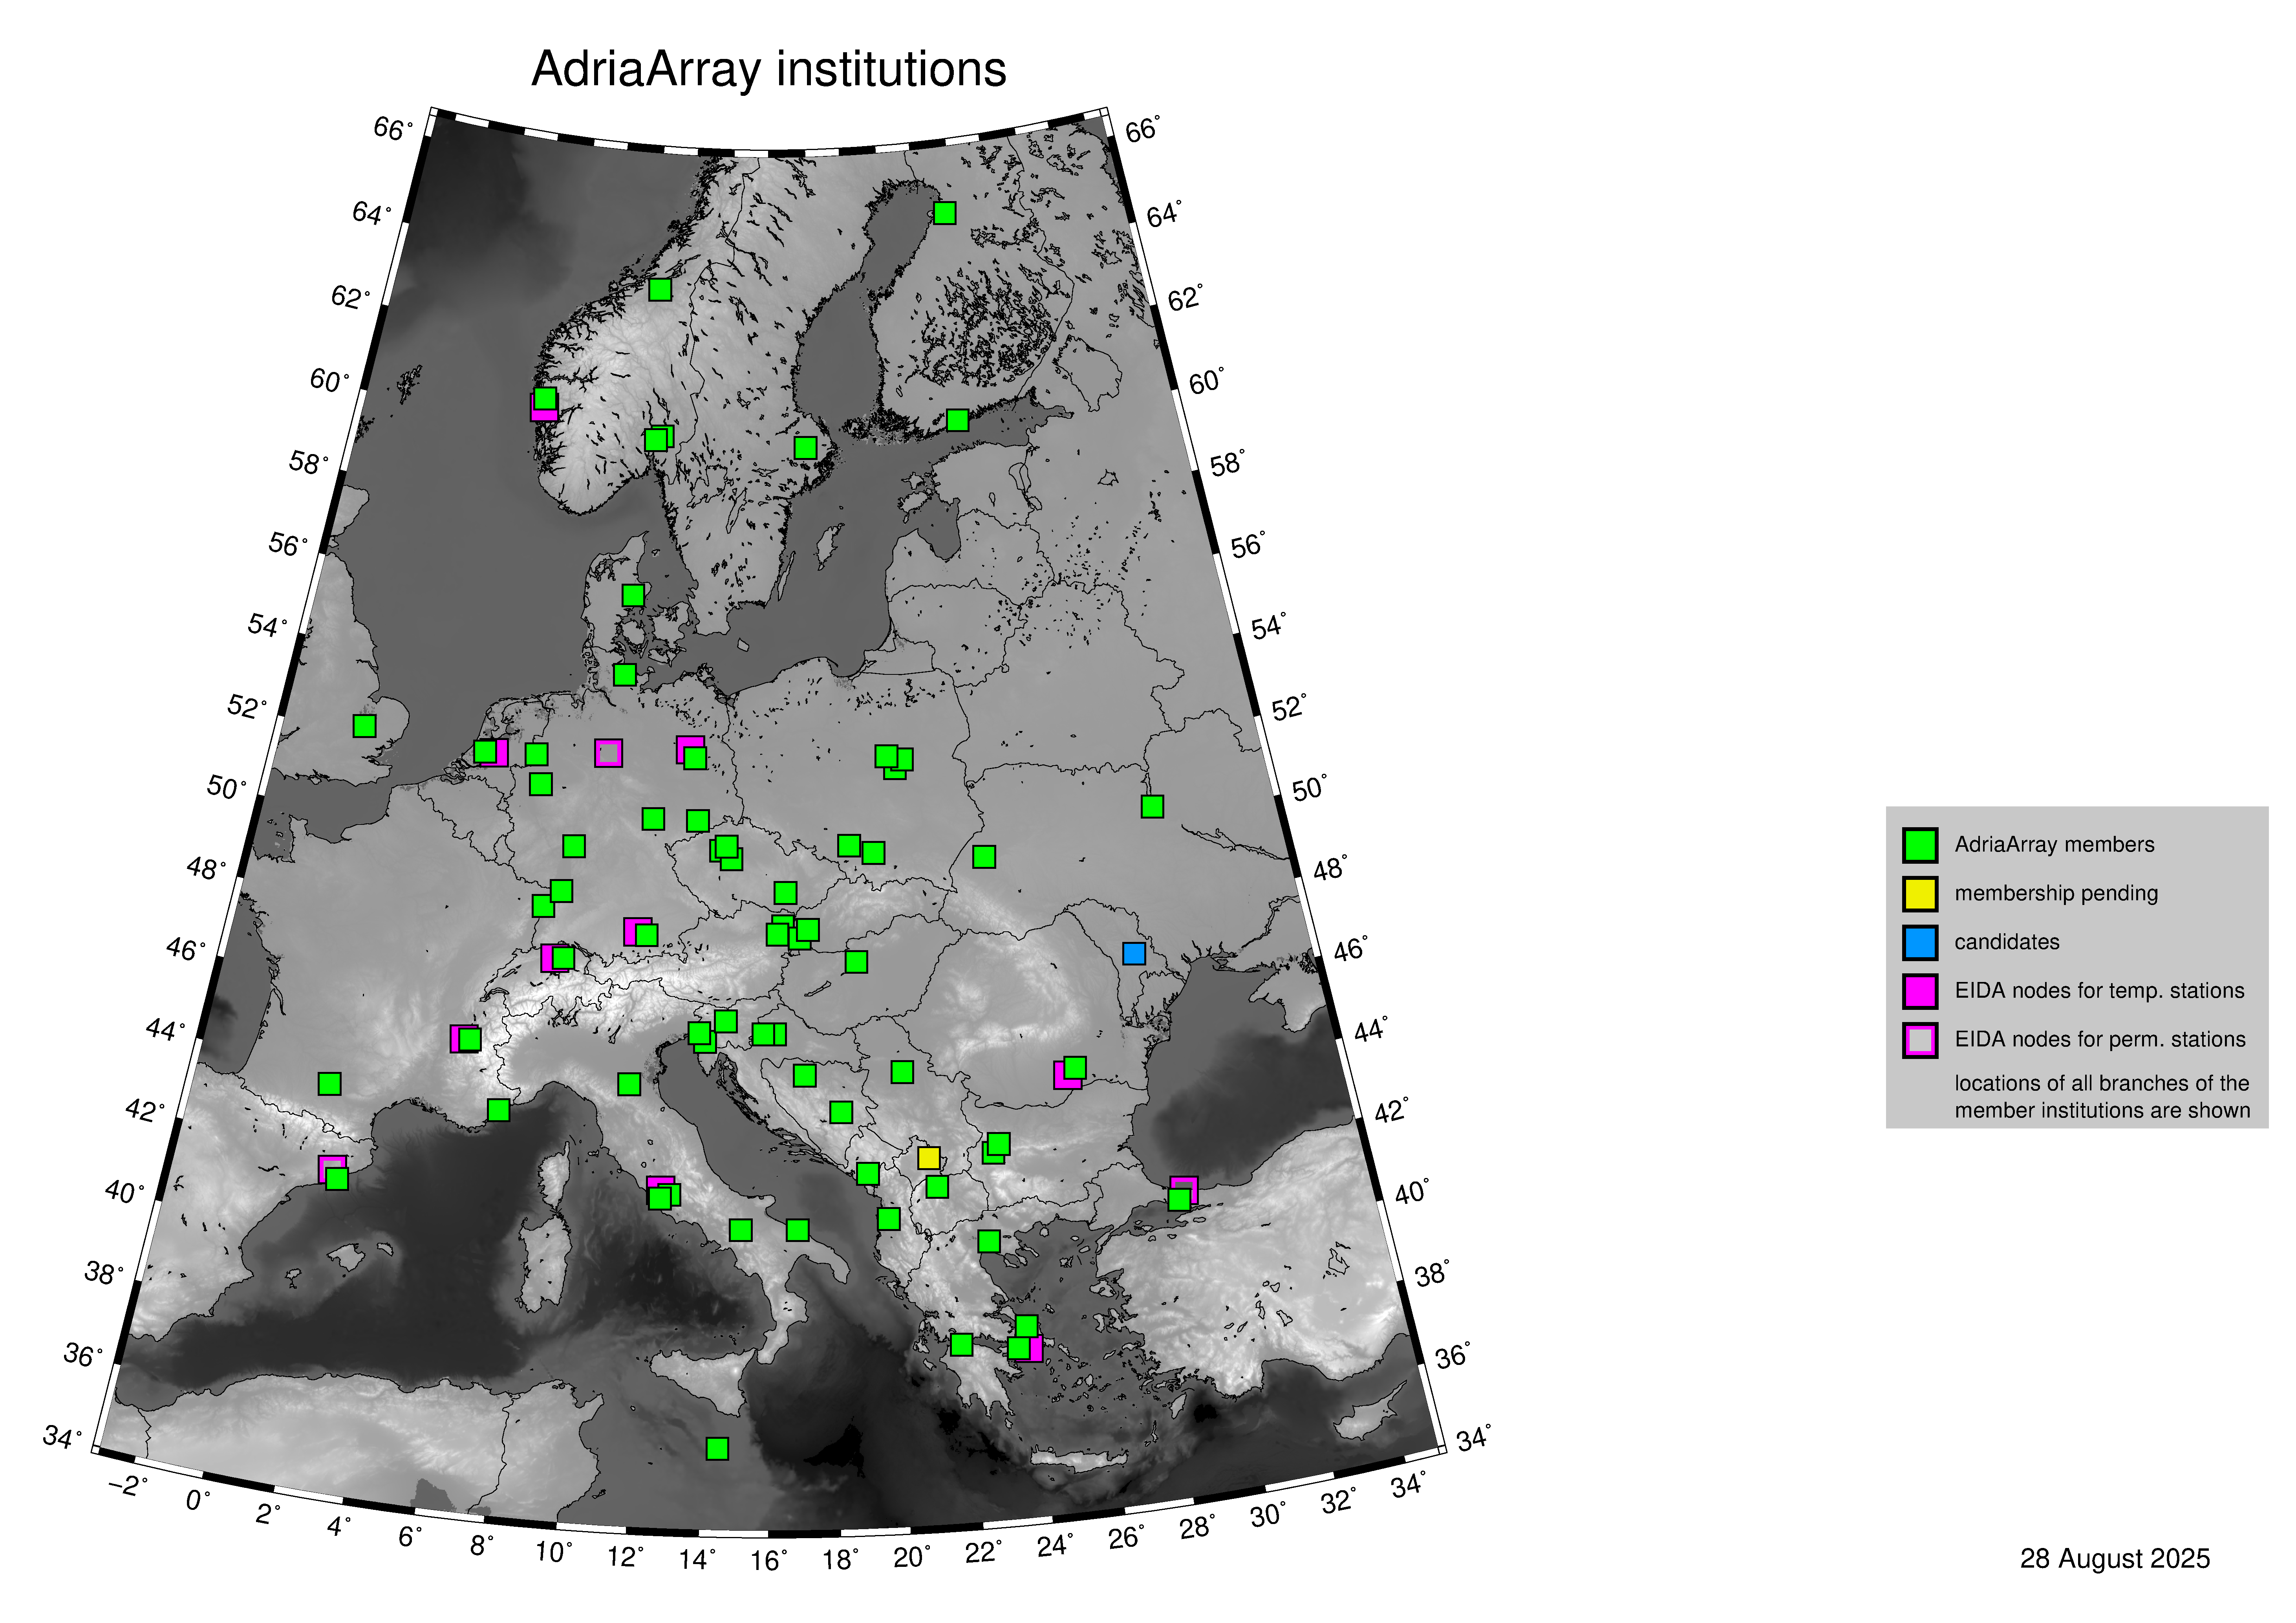
Relation between EIDA nodes and network codes:
AdriaArray - Local experiments
Plate-scale observations taking advantage of the AdriaArray Seismic Network backbone are complemented by local and Large N experiments in key areas. Here we list the local experiments with the contact person who can provide more information.
profile from Poland to Slovakia,
Additional 18 stations.
Contact: Stanisław Mazur, Christian Schiffer, and Ulrich Wegler.
denser network at the coast of Croatia,
Local densification.
Contacts: Stéphane Rondenay and Josip Stipčevič.
large-N array in Albania,
Additional 400 sensors (not in the maps).
Contact: Andreas Rietbrock
denser network in Romania,
4 additional stations in Vrancea, Romania.
Contact: Renata Lukešová
AdriaArray - Data availability
EIDA Nodes
Data access through EIDA (European Integrated Data Archive) is managed by EIDA. AdriaArray participants get immediate access via FDSN (Federation of Digital Seismograph Networks) web services within ORFEUS (Observatories & Research Facilities for European Seismology) to permanent and temporary stations belonging to AdriaArray for research agreed upon by the Steering Committee for AdriaArray Seismology Group (Memorandum of Collaboration (MoC) ). Data of temporary AdriaArray on-shore stations delayed due to lack of telemetry and/or due to quality control procedures become accessible to AdriaArray participants via FDSN web services as soon as possible, but not later than one year after acquisition. Rotated and timing-corrected OBS data become available via FDSN web services to AdriaArray participants as soon as possible, but not later than one year after recovery.
Data access options [permanent stations]
The Memorandum of Collaboration (MoC) states that for permanent stations within the AdriaArray initiative, the data and metadata have fully open access via EIDA from day 1 (deployment of the station).
Data access options [temporary stations]
The Memorandum of Collaboration (MoC) states that for temporary stations within the AdriaArray initiative, there are two options for data access to AdriaArray stations via the EIDA infrastructure by non-members:
fully open access via EIDA from day 1 (deployment of the station);
rolling embargo of two years after acquisition (i.e, data become fully open two years after acquisition).
The AdriaArray Seismology Group members deploying or hosting temporary AdriaArray stations specify whether they opt for 1.) or 2.) for temporary AdriaArray stations upon signature of this Memorandum of Collaboration (MoC).
AdriaArray members have full access to the data from all temporary stations from day 1 (deployment of the station).
How to access the data?
Permanent stations, temporary stations with open access as well as metadata (stationXML) of all stations (including embargoed) are available to AdriaArray members and non members through EIDA nodes.
In order to access the embargoed AdriaArray data, EIDA Token is needed. The token act as login and passwords while requesting waveforms.
EIDA Token
The seismic data is available to the participants through EIDA nodes.
The metadata are openly available, but accessing the embargoed waveforms requires an authentification.
In order to get a token that would give you access to the embargoed AdriaArray data, the procedure is the following:
- Register to B2Access
If you already have a B2Access account, go to 2) If you do not have a B2Access account, please visit this link
Please go to the link “No account, sign up”. You need to create a B2Access user account (either with a username or with a certificate, up to you, no difference here). The most important is that you need to click “Select group:” and request to be part of EPOS. Otherwise, you won’t be able to access the data.
- Granting permission.
Then, please let Gregor Rajh know which email was registered, to be added to the AdriaArray group.
Some nodes (as NIEP) require a manual update of the email list, and it may take a few more days to access the full database (i.e. Y8 network code).
With this token, you should have access to all the AdriaArray data that are online. Any token generated before being added to the EPOS group will not give you access to the embargoed data. The representative of Working Group ‘Communication and Outreach will contact you to confirm that your account has been added to the AdriaArray group as well as to the list of users that are allowed to request data from NIEP.
You will then be able to request a token there
- Token properties:
In the readable part of the token, there are several fields that can be checked easily:
"valid-until": "2022-02-20T02:20:02.200220Z" # Validity of the token
"cn": "Gregor Rajh"                          # Your name
"memberof": "/epos;/epos/Y0HBP;/"            # Your permissions
/epos/Y0HBP is the technical name of /EPOS/AdriaArray!
Please check carefully: In your token, if the field “memberof” does not include “/EPOS”, you may need to create a new account. In point 1) Register to B2Access, you did not request to be part of EPOS.
If you are a member of “/EPOS” but you are not a member of “/EPOS/Y0HBP”, you need to wait to be added to the AdriaArray group by the representative of Working Group ‘Communication and Outreach’.
- Data download
Once you have a valid token, you should have access to the embargoed data hosted in EIDA. Please check carefully your token (“memberof” and “valid-until”) before requesting any data.
Retrieving metadata using webbrowser
Example with open station
Obtain the metadata for the station OE-CONA for all 3 components.
https://www.orfeus-eu.org/fdsnws/station/1/query?net=OE&station=CONA&channel=???&level=response
Example with embargoed station
Obtain the metadata for the station Z6-A090A for all 3 components.
https://erde.geophysik.uni-muenchen.de/fdsnws/station/1/query?net=Z6&station=A090A&channel=???&level=response
Retrieving waveforms using webbrowser
Example with open station
Obtain 2 hrs of the record of the big Türkiye earthquake from February 6, 2023 from the station OE-CONA:
https://www.orfeus-eu.org/fdsnws/dataselect/1/query?net=OE&station=CONA&start=2023-02-06T01:00:00&end=2023-02-06T03:00:00
Example with embargoed station
This example will require to have a valid token. In this example, the token is found at ‘/home/myusername/.eidatoken’.
This is a two step procedure, detailed there.
In a first step, you can request a username and password for /queryauth using wget, curl or similar tools:
- Using wget:
$ wget --post-file /home/myusername/.eidatoken https://geofon.gfz-potsdam.de/fdsnws/dataselect/1/auth -O cred.txt
- Using curl: $ curl --data-binary @/home/myusername/.eidatoken https://geofon.gfz-potsdam.de/fdsnws/dataselect/1/auth -o cred.In a second step, you can either use direct download:
http://`cat cred.txt`@geofon.gfz-potsdam.de/fdsnws/dataselect/1/queryauth?starttime=2015-12-15T16:00:00Z&endtime=2015-12-15T16:10:00Z&network=IA&station=AAIOtherwise, you can use the FDSNWS tools:
- Using wget:
$ wget "http://`cat cred.txt`@geofon.gfz-potsdam.de/fdsnws/dataselect/1/queryauth?starttime=2015-12-15T16:00:00Z&endtime=2015-12-15T16:10:00Z&network=IA&station=AAI" -O data.mseed
- Using curl: $ curl --digest "http://`cat cred.txt`@geofon.gfz-potsdam.de/fdsnws/dataselect/1/queryauth?starttime=2015-12-15T16:00:00Z&endtime=2015-12-15T16:10:00Z&network=IA&station=AAI" -o data.mseed
Retrieving waveforms using fdsnws_fetch
The fdsnws_scripts, which includes fdsnws_fetch, is a collection of next-generation distributed data request tools that are based on FDSN web services and the EIDA routing service. Note that the EIDA token is assumed to be ~/.eidatoken
fdsnws_scripts can be install directly from pip:
$ pip install fdsnwsscripts
You supply the time window and channel information in one command:
$ fdsnws_fetch -vvv -N Z6 -C "HHZ" -s "2023-02-06T01:00:00" -e "2023-02-06T03:00:00" -o data.mseed
More details can be found there.
Retrieving data using the Orfeus/EIDA web interface
Retrieving metadata using Obspy
Simple python script example to request the stationXML files for the 1Y network.
import obspy
from obspy.clients.fdsn import RoutingClient

inv = RoutingClient("eida-routing", credentials={'EIDA_TOKEN': './eidatoken.pgp'}).get_stations(starttime=obspy.UTCDateTime(), network="1Y", level="station")
print(inv)
### Uncomment the next line to save the stationXML file locally.
# inv.write("example.xml",format="STATIONXML")
Retrieving waveforms using Obspy
Simple python script example to request the 3 component waveforms for the 1Y network .
import obspy
from obspy.clients.fdsn import RoutingClient
from obspy import UTCDateTime

t = UTCDateTime("2023-01-10T01:25:00.000")
st = RoutingClient("eida-routing", credentials={'EIDA_TOKEN': './eidatoken.pgp'}).get_waveforms(network="1Y", station="*", channel="*", location='*', starttime=t, endtime=t + 1 * 60)
print(st.__str__(extended=True))
### Uncomment the next line to save the miniSEED file locally.
# st.write("example.mseed",format="MSEED")
Retrieving the waveforms & Virtual AdriaArray network
(By Johannes Stampa).
User documentation is available online. Full documentation is provided on the EIDA users feedback.
The recommended way to download data from the AdriaArray stations is via a download script, using the obspy library in the python programming language. A basic code example will be given at the end of this section. The full API documentation for obspy is available here.
Since some of the AdriaArray data will be embargoed at first, we will need to authenticate our user to download it. This is done by passing a valid eidatoken when we initialize the RoutingClient. This RoutingClient will also take care of figuring out which networks are hosted at which data centers for us. Additionally, we can use the _ADARRAY virtual network code to further simplify our request. This virtual network includes all station in a geographic region around the Adria, so it is very easy to request all the data at once, as shown in the example at the end.
When we do these kinds of requests, we have to keep in mind how much data we are requesting. Once everything is deployed, there will be roughly 1050 permanent stations, as well as almost 450 mobile stations as part of the AdriaArray. An hour of data sampled at 100 Hz is about 1.5 MB, and all the data we request at once will need to reside in the system memory. Requesting a whole day for all the stations might take more than 64 GB of RAM, triple that if we request all three components. In those cases, it is prudent to split the request into smaller chunks, for example by looping over the stations individually.
In the example, we request 2 hours of data, so it might take 15 minutes (or more) to download everything.
Note the call to merge at the end. Sometimes, the requested data will be fragmented into shorter segments, and merging it makes it easier to handle the data for subsequent processing or saving.
Lastly, we can save the data to the harddrive for later processing and analysis.
If you run into problems with the download, an Issue Tracker is enabled at GitHub so that users can report problems when trying to access the data. These issues are checked continuously, in order to provide a solution as soon as possible.
Before submitting an issue, please check that the problem has not been previously reported.
At the moment of creating the issue you will see some templates for different types of problems (e.g. no data, wrong metadata, authentication). Make good use of the issue templates, as they have a list of the information we would need to find a suitable solution.
Example Python code
(By Johannes Stampa).
 1import os
 2from obspy import UTCDateTime
 3from obspy.clients.fdsn import RoutingClient
 4### This assumes that the eida-token is located in the home folder.
 5token=os.path.expanduser('~/eidatoken.pgp')
 6### Initialize the Routing Client with eida-token identification.
 7Client = RoutingClient('eida-routing',
 8timeout=30,
 9credentials={'EIDA_TOKEN': token})
10
11### Define start and end times for the data.
12start = UTCDateTime(2023,4,24,20,0)
13end = UTCDateTime(2023,4,24,22,0)
14
15### Request the waveforms. This example requests all Z-component seismometer data
16### for all  stations in the virtual _ADARRAY network.
17waveforms = Client.get_waveforms(network='_ADARRAY',
18channel='*HZ',
19starttime=start,
20endtime=end)
21
22### Attempt to merge the waveforms that arrived fragmented.
23waveforms.merge()
24
25### Save the data to disk
26waveforms.write('AA_example_data.mseed',format='MSEED')
How to cite the data?
For each network code belonging to the AdriaArray initiative, a DOI will be registered, allowing to cite the data.
As an example, the 1Y network can be cited as follow:
Wolfgang Friederich, Christos Evangelidis, Costas Papazachos, Efthimios Sokos,
George Kaviris, & Dragana Cernih. (2022).
AdriaArray Temporary Network: Greece, North Macedonia [Data set].
International Federation of Digital Seismograph Networks.
https://doi.org/10.7914/y0t2-3b67
AdriaArray - Data retrievability and quality
Data retrievability and data quality are regularly checked by members of Working Group 3 ‘Data QC’.
There are four tests provided by J. Stampa, F. Eckel, L. Vecsey and P. Kolínský.
There is a summary of the data and metadata quality tests. It was presented as a poster at the 2024 EGU. The poster and a summary table are available here.
More metadata issues are reported at the EIDA issue tracker as for example here.
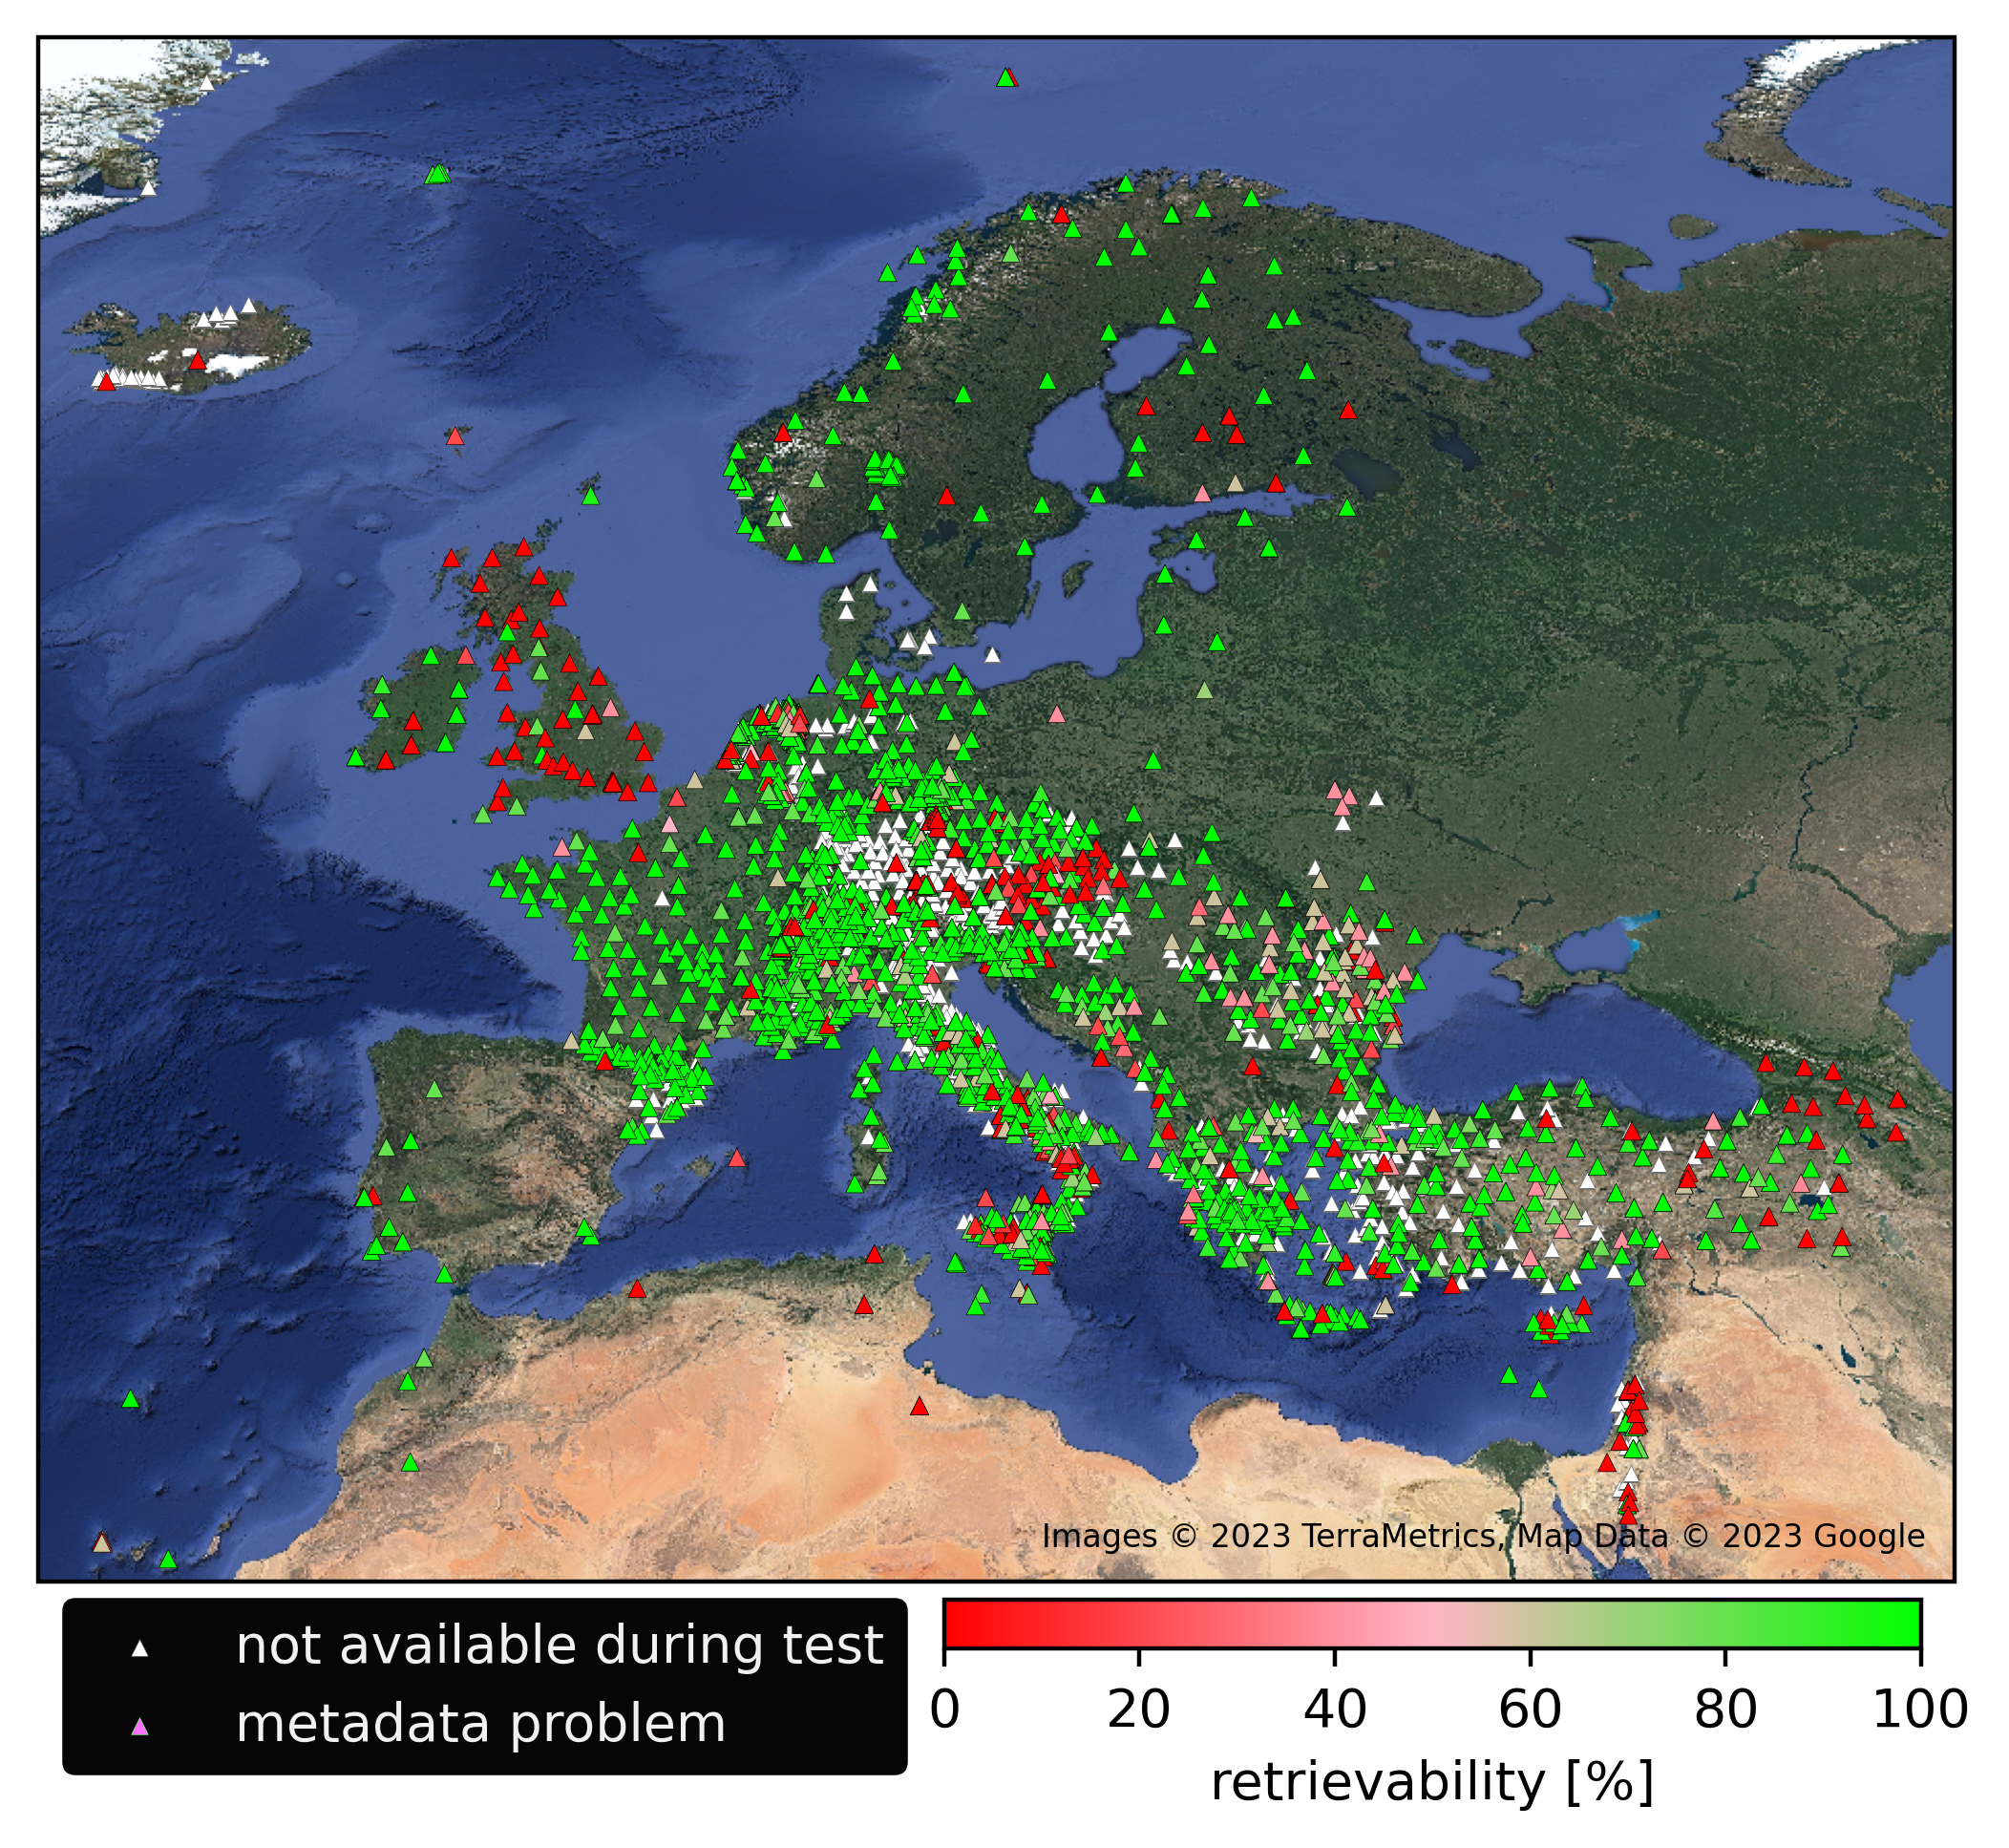
Data retrievability
Tests by J. Stampa:
Most of the retrievability tests were performed by J. Stampa, F. Eckel, J. Stampa, M. Timko, J. Quinteros and L. Vecsey.
The retrievability tests were conducted from an end user perspective, using a custom python script including functions from the obspy library. Essentially, for each station, a spot check is performed by choosing random one-hour time windows to download, requesting these time window from the data center, and then performing the response correction on the downloaded data. The ratio of the length of the successfully downloaded and response corrected data and the requested time windows is evaluated as the retrievability percentage for the respective stations. These tests were conducted from multiple locations simultaneously, to reduce the effect of client side connection issues on the result.
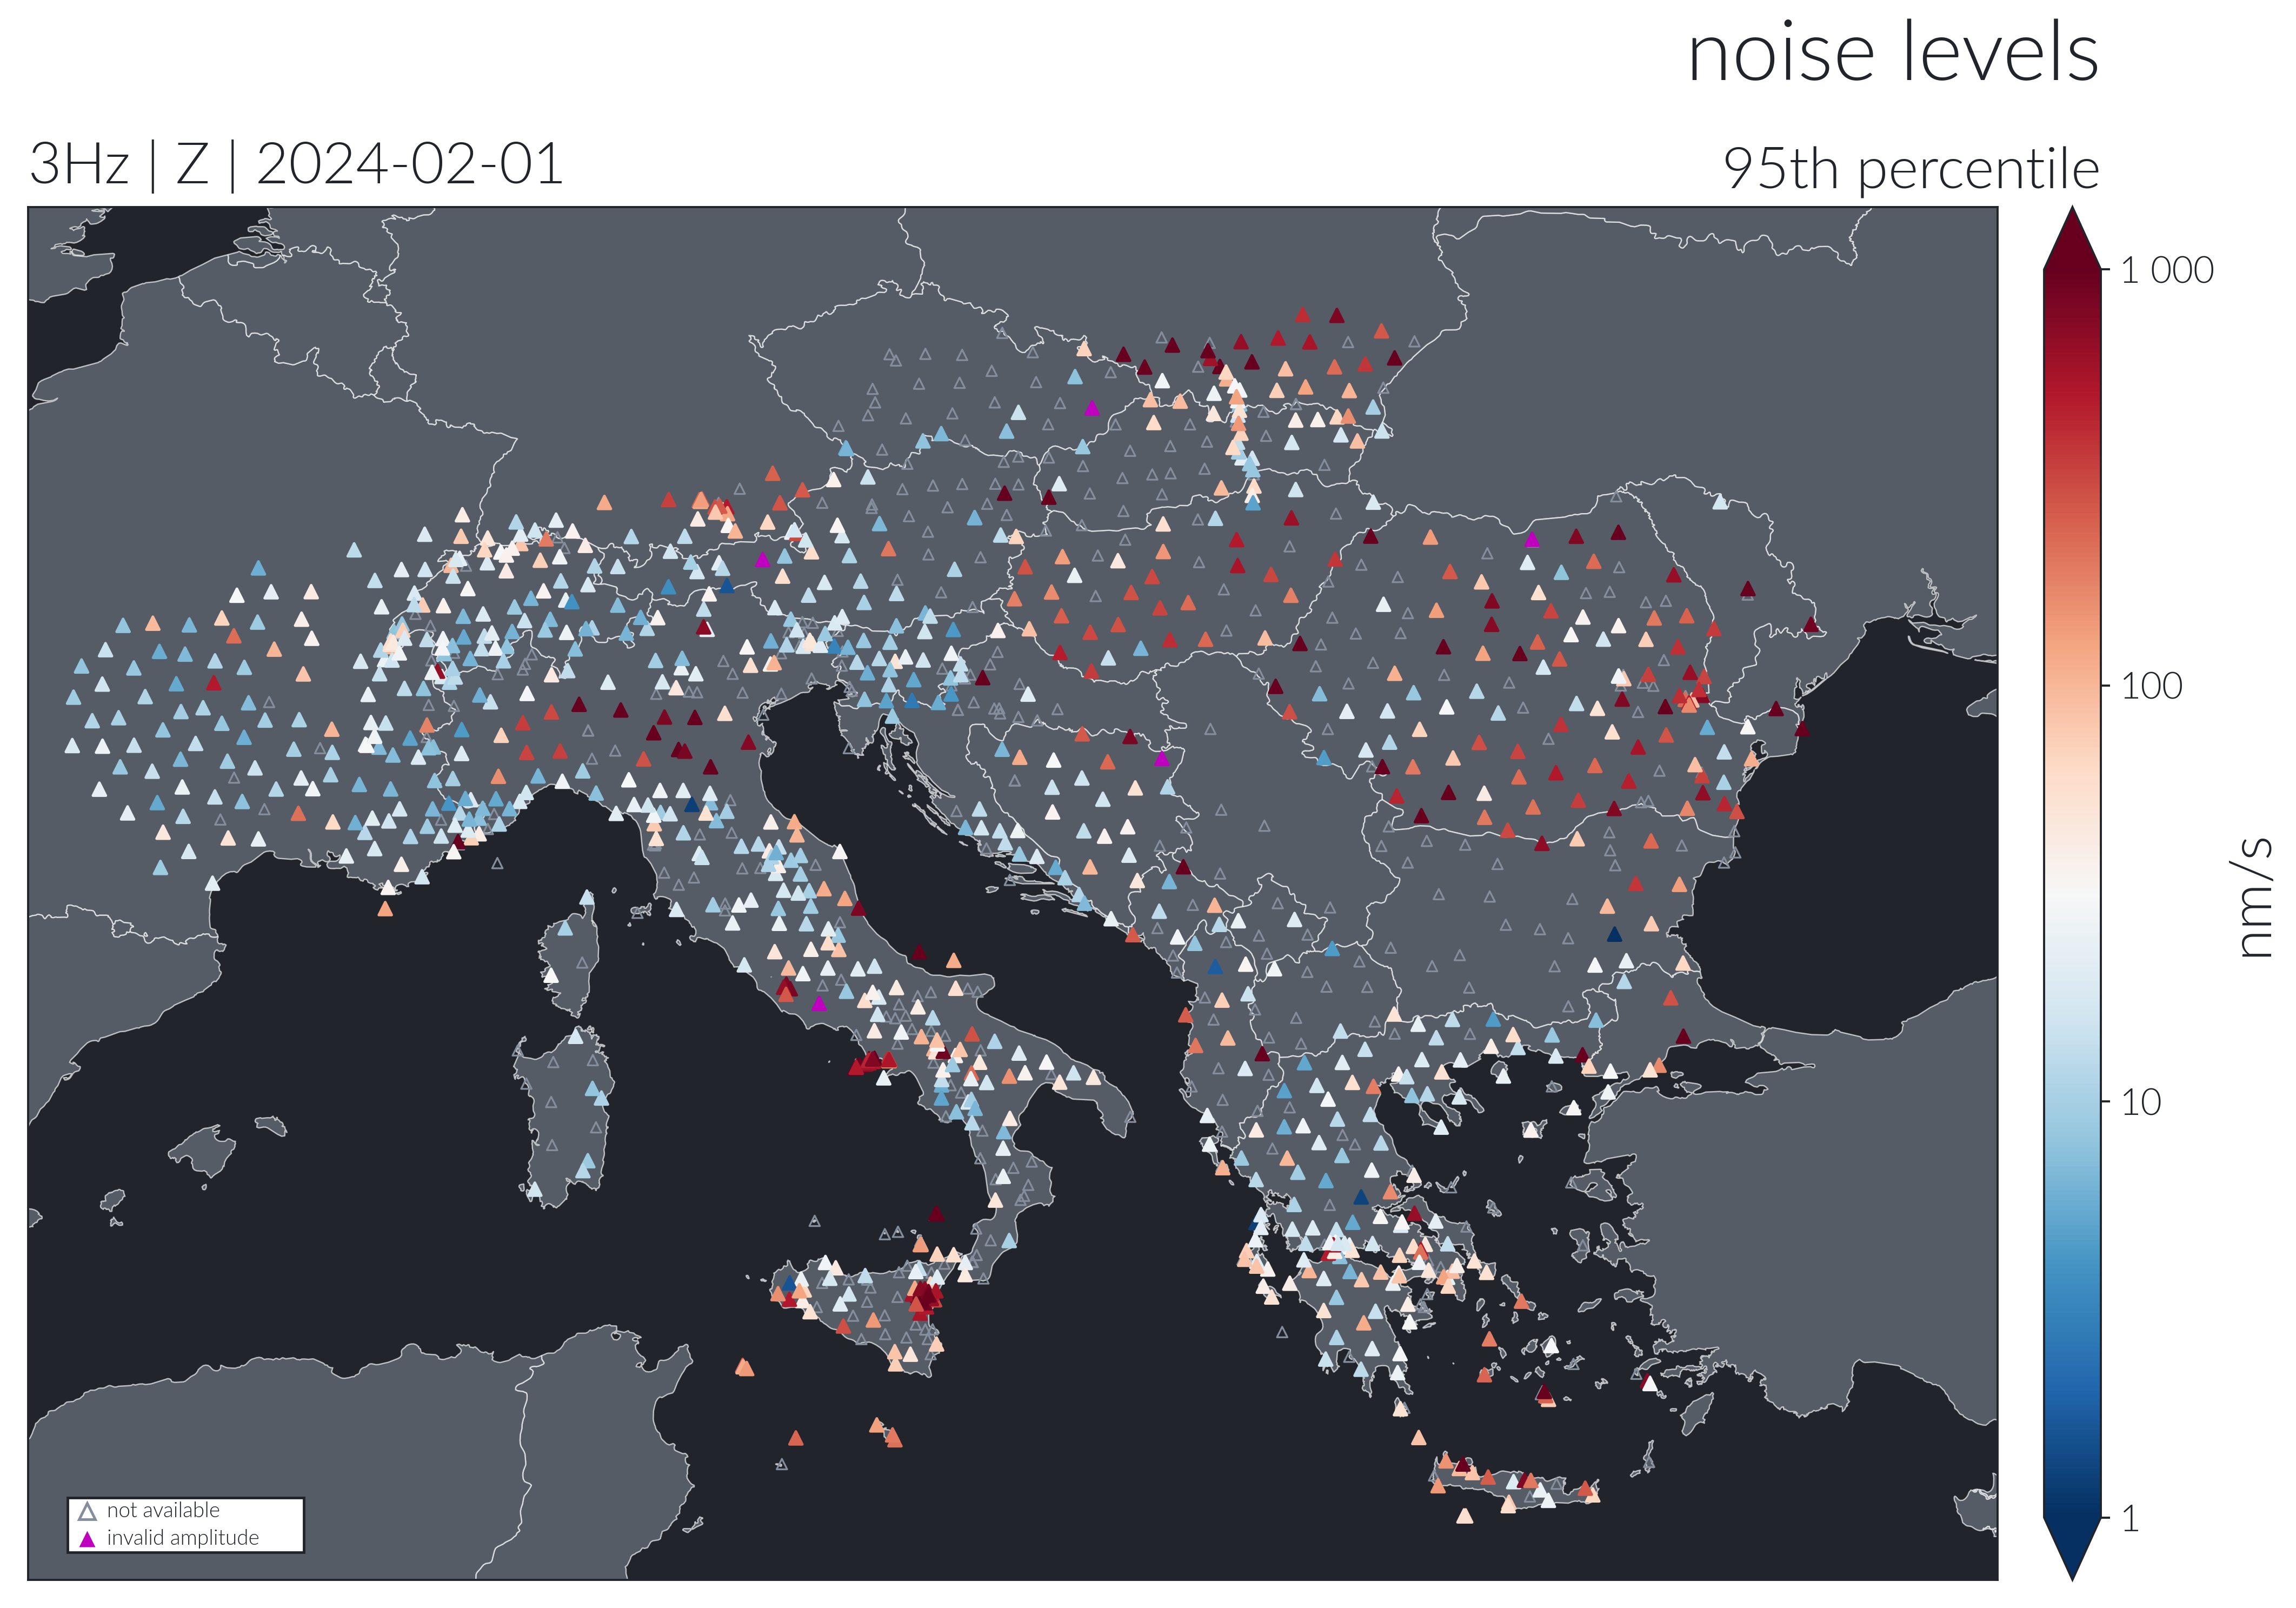
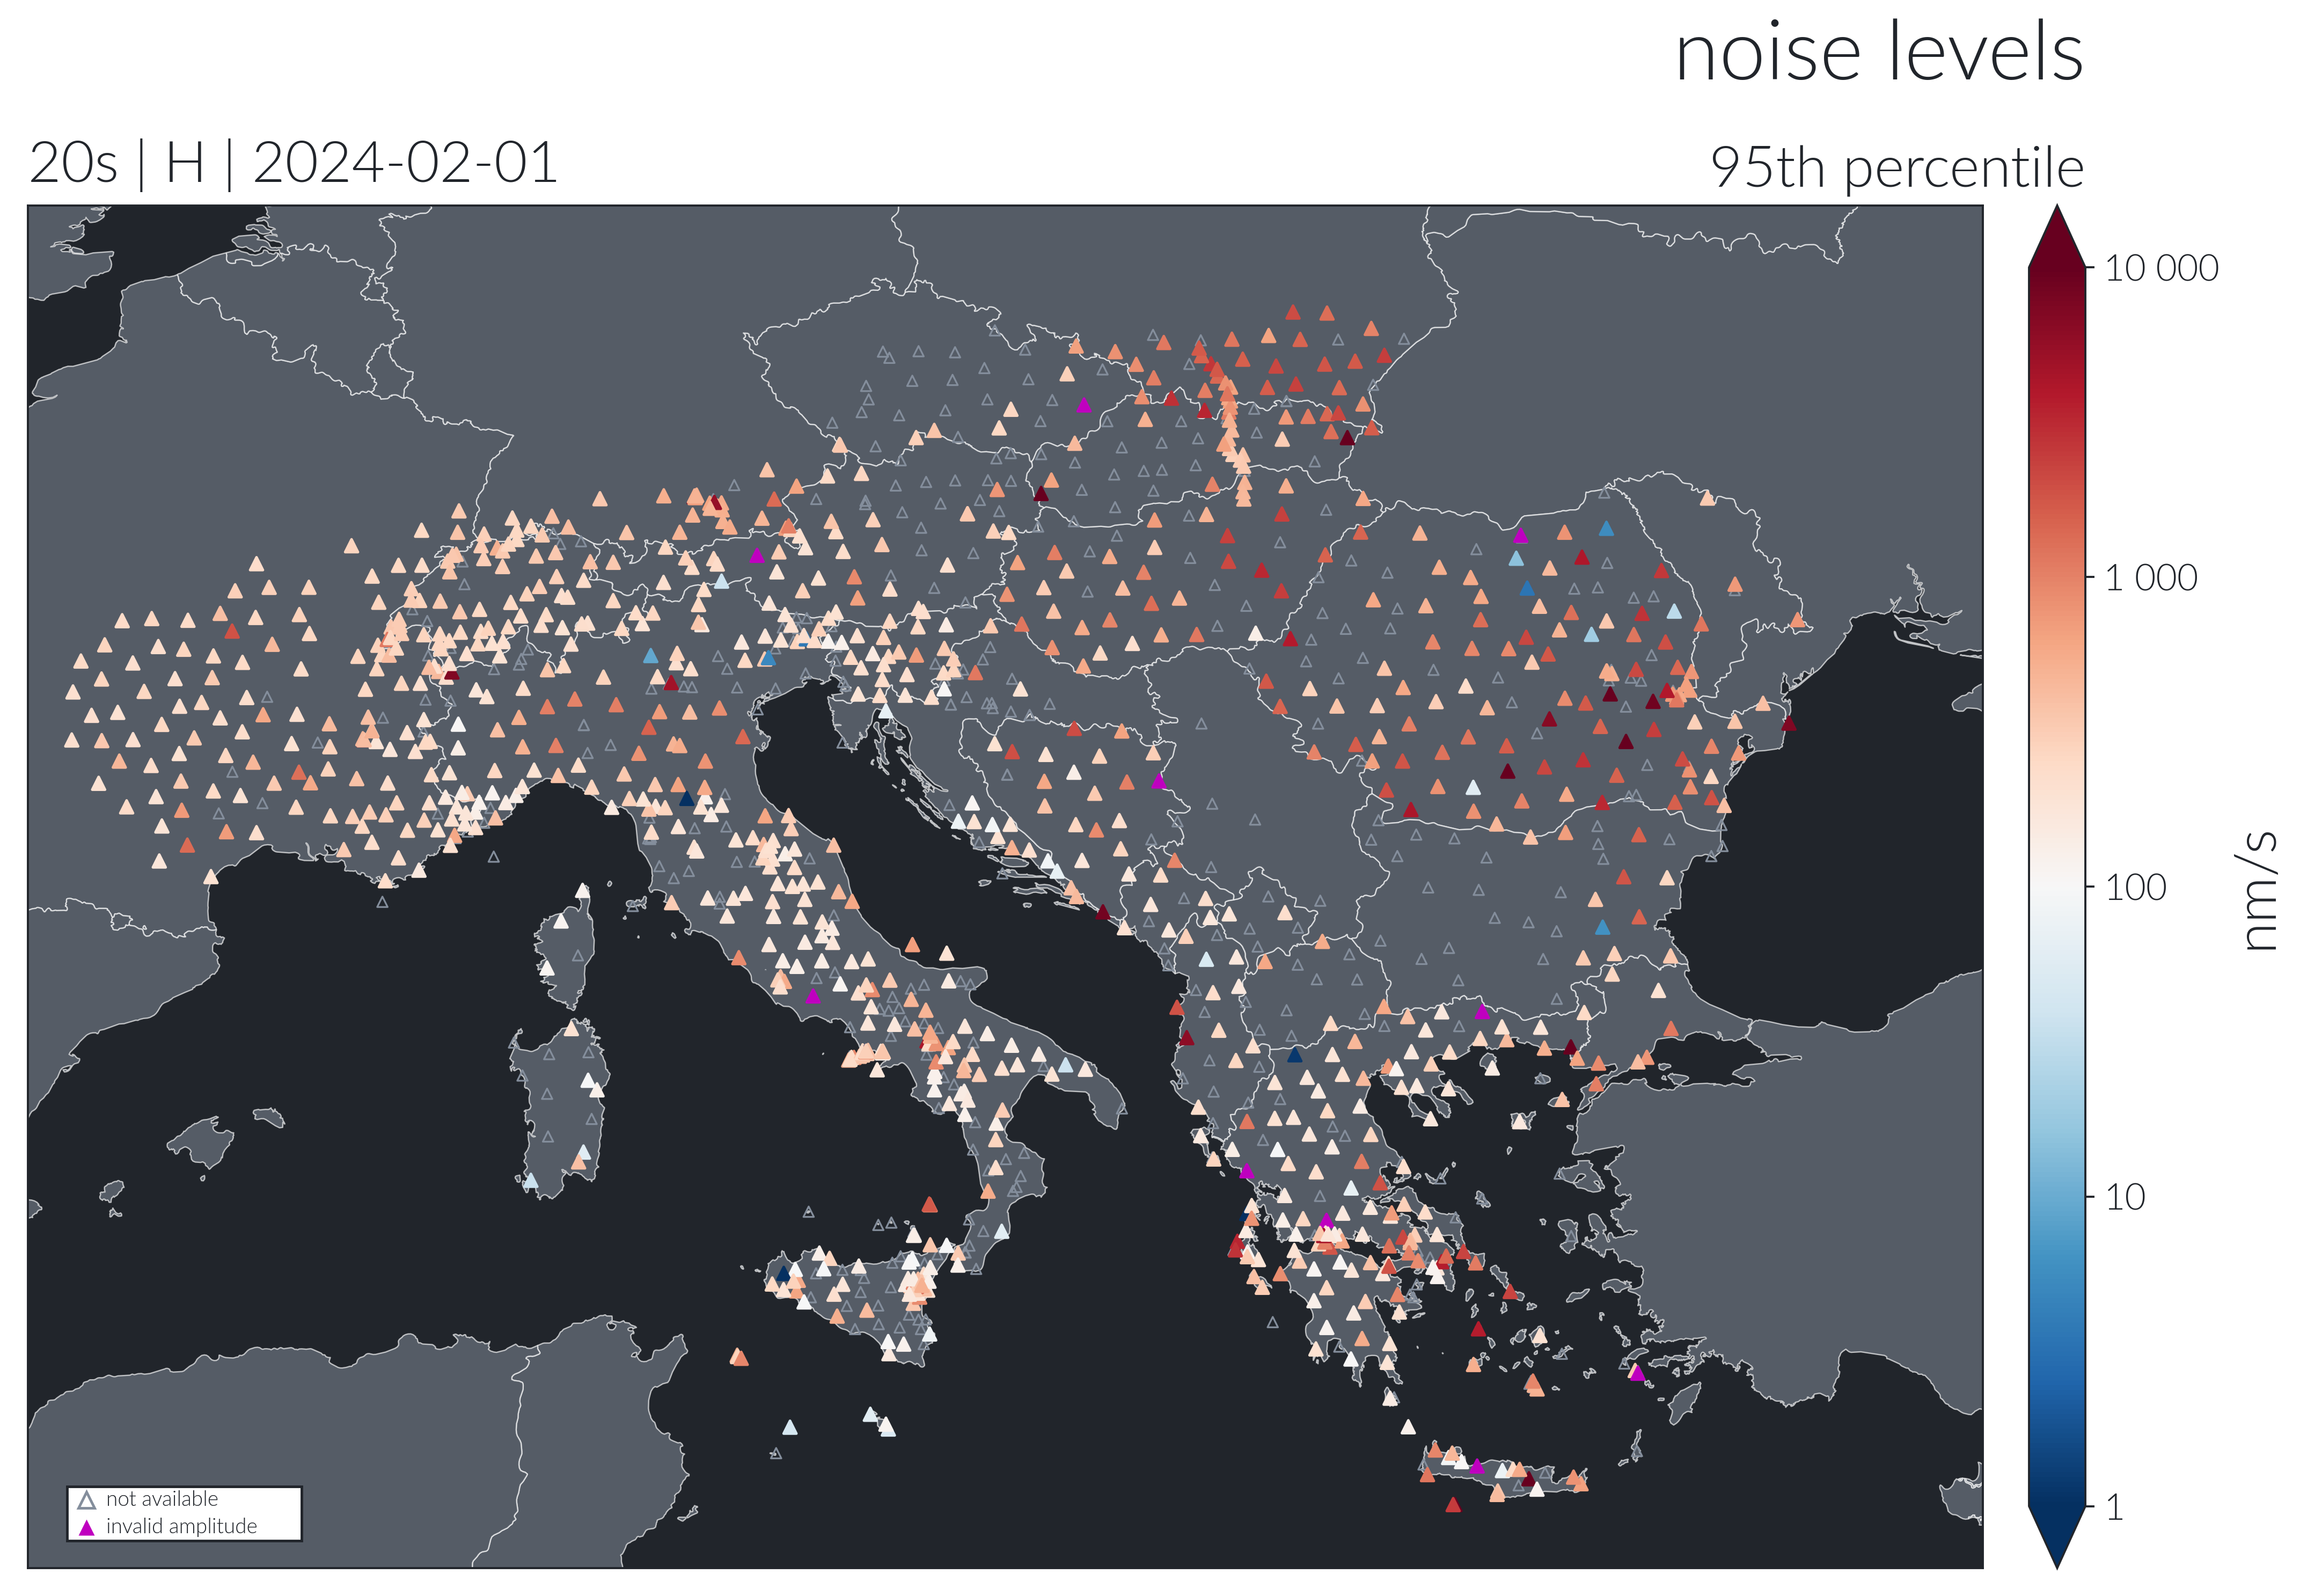
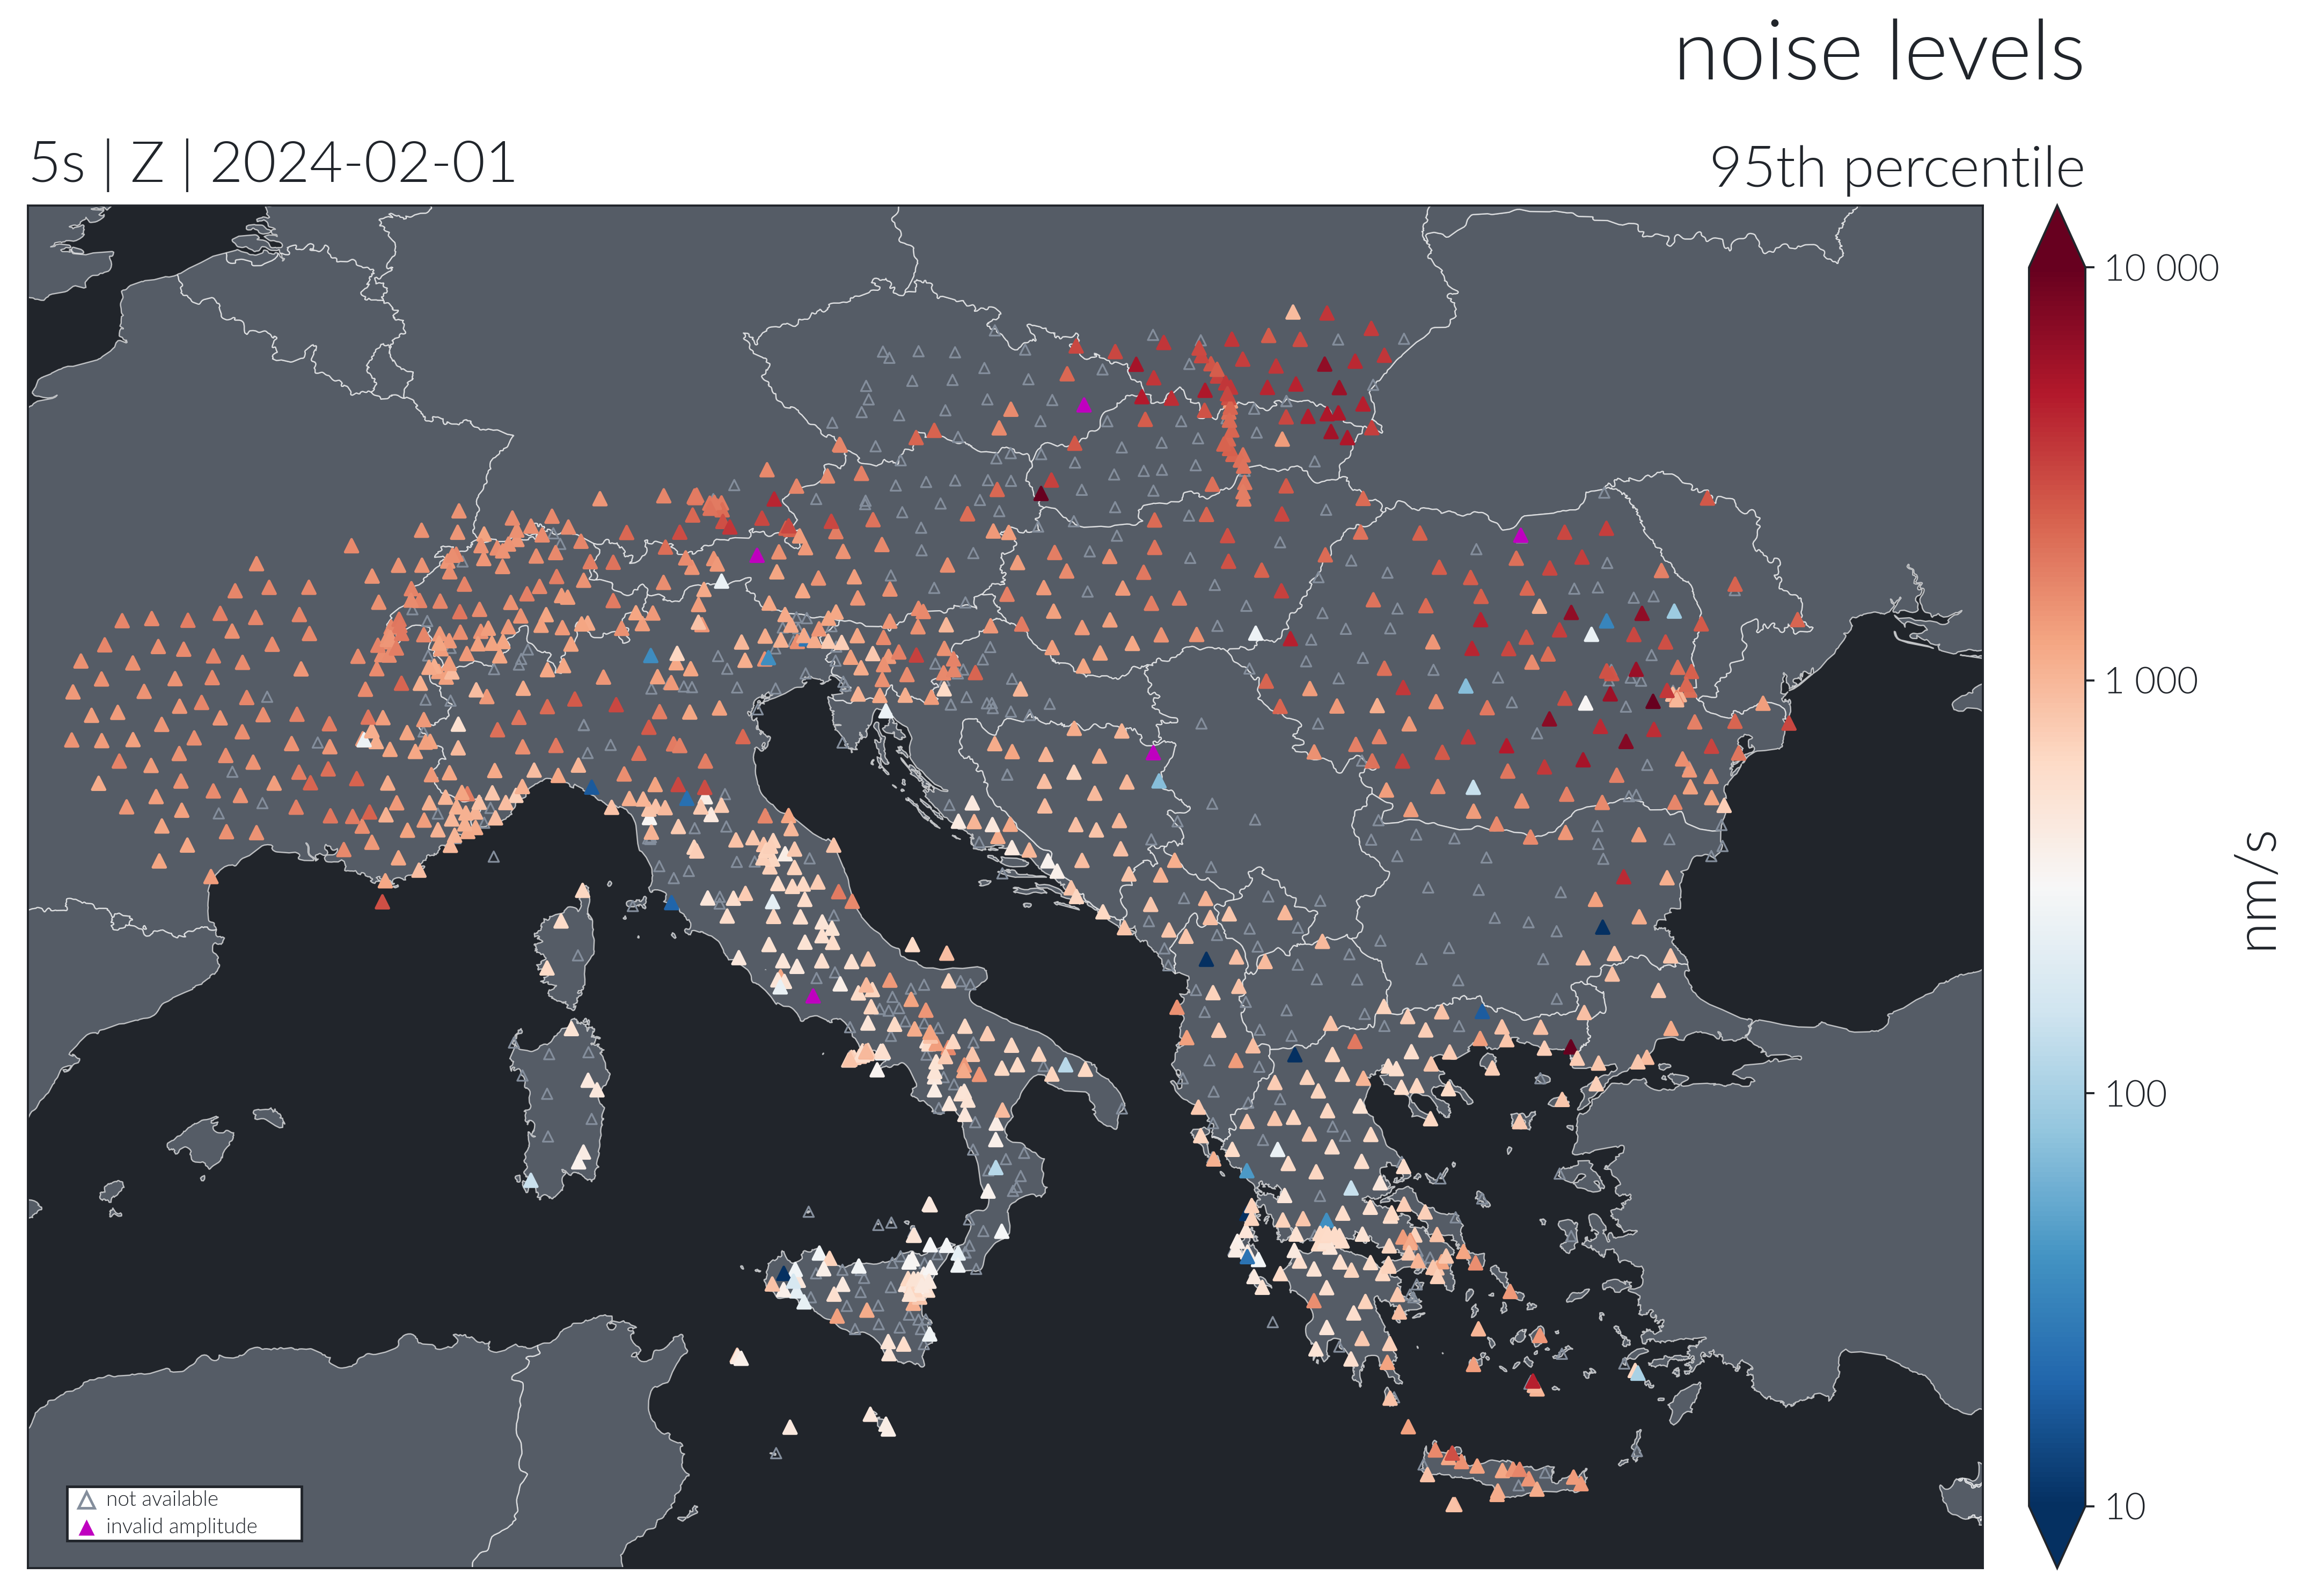
Noise levels
Tests by F. Eckel:
Average ambient noise levels can be used as a quality measurement to identify erroneous metadata or poorly behaving stations. This becomes even more powerful when comparing noise levels with neighboring stations. For the quality tests, 24 hours of data on a day without any major teleseismic earthquake are downloaded for all retreivable stations and filtered around 3.0 Hz and 5 s respectively on the vertical component or around 20 s on the horizontal component. Then the 95th percentile of the absolute amplitudes are defined as the ‘noise level’ and color coded on a map. Outling stations are now easily identifiable.